How Are Exceptions Evaluated?
Overview of the Exception Evaluation Process
Exceptions are identified
by evaluating the data in the input table, which can be filtered,
using the criteria specified in the exception definitions that are
listed for the transformation. Exceptions that are identified are
written to the target exception table. (You can also specify that
more detailed information be written to the exception condition table). For information about
how to specify an exception, see Working with the Exception Transformation.
Filtering Data for the Exception Evaluation Process
The data is first filtered
according to any specifications in the Exception transformation’s Filters tab.
The filter can be based on a user-specified expression such as a
list of resources that you are interested in. The following expression
is an example of this type of filter:
MACHINE IN (‘one’, ‘two’, ‘three’)
The filter can also
specify other user requirements such as filtering by router type,
or excluding time periods that are not of interest. The following
expression is an example of this type of filter:
DAYOFWEEK^=’Sat’ AND DAYOFWEEK^=’Sun’
The Last
Time Periods field can also be used to filter the incoming
data.
If a filter is not defined,
then all the input data is considered for evaluation.
Evaluating the Exception Definition
After the data is filtered,
each observation is evaluated using the exception expression from
each of the exception definitions in the transformation. For each
incoming observation (of the filtered data), the exception expression
is determined to be either true or false for each exception definition.
At this point, observations
for which the expression is true are only potential occurrences of
an exception. This is because there are grouping and occurrences attributes
of the exception definition that factor into whether an exception
is found or not. These values affect whether an exception has been
detected:
-
Grouping is specified on the Specify Grouping page of the Exception Definition wizard.Group By columns define the grouping that organizes the data to evaluate. After the grouping data is evaluated, a set of potential exceptions is identified. If no grouping is specified, then the entire incoming data is evaluated as a single group.Note: In addition, if no Group By column is selected, “For All Data” is displayed on the overview report, rather than a specific by group values, if that report is generated.
-
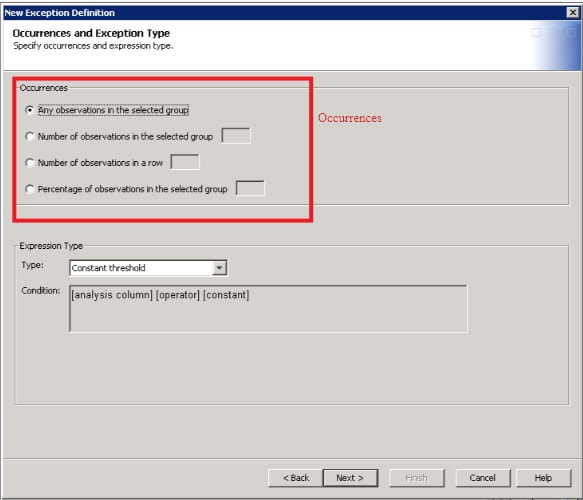
The occurrences attribute of the exception definition is used to evaluate any potential exceptions to determine whether actual exceptions exist. The occurrences value is specified on the top part of the Occurrences and Exception Type page of the Exception Definition wizard. The occurrences part of the page is outlined in red in the following display:
Processing Exceptions
An exception is flagged
only if both the exception expression and the occurrences specification
are satisfied.
If the criteria of an
exception definition are met, one observation is written to the exception
table, which is considered to be one exception. At the same time,
for that group, all observations for which the expression is true
are written to the exception condition table. (If you have not specified
an exception condition table, this information is written to an internal
work table.) If no exception is found for a given group, then nothing
is written for the group to either table, and nothing further is done
for that group.
For example, suppose
that the expression was true for 5 observations in a group for a
particular exception definition. However, the Occurrences section
of the exception definition specified a Percentage of
observations in the selected group of 25%. If a group
consisted of 25 observations, and the expression was true for 5 observations
(which is 20% of the group), the criteria for an exception are not
met. Therefore, no exception would be found. Because no exception
was found, the following statements are applicable:
-
No observation is written to the exception table.
-
No observations are written to the exception condition table, if the creation of this table was specified.
However, using the
same example, imagine if the expression was true for 7 observations.
In this case, an exception would be found, because 28% is above 25%.
Because an exception was found, the following statements are applicable:
-
One observation is written to the exception table.
-
Seven observations are written to the exception condition table, if it was specified.
Handling Missing Values
Missing Values in the Constant Threshold, Other, Range, and Statistic Bounds Types
If an observation has
missing values for any numeric columns that are specified in the expression,
then the observation is skipped before the data is evaluated. (This
does not apply to character columns with missing or blank values.)
For example, suppose
the exception definition has these characteristics:
-
Occurrences: 3 in a row
-
Type: Constant
-
Analysis column: AVENQUEMAX
-
Expression: AVENQUEMAX > 1
If the incoming observations
have the pattern of missing values that is shown in the following
table, then an exception is found. The exception is found because
the observation at 01Jan2013:00:30 is omitted before evaluation (due
to a missing value for AVENQUEMAX). Thus, three observations in a
row are detected where
AVENQUEMAX>1.
|
Datetime
|
AVENQUEMAX
|
|---|---|
|
01Jan2013:00:00
|
1.234
|
|
01Jan2013:00:15
|
1.329
|
|
01Jan2013:00:30
|
.
|
|
01Jan2013:00:45
|
1.002
|
Note: A value of ‘.’
for a numeric column is the standard SAS way of denoting a missing
value.)
Copyright © SAS Institute Inc. All rights reserved.
