Statistical Graphics
You can use the BOX subroutine to create a box plot. The required argument is a vector that contains values of a continuous variable. Optionally, you can specify a categorical variable in order to obtain multiple box plots.
The following statements read several variables from a subset of the Sashelp.Cars data set:
proc iml;
use Sashelp.Cars where(type ? {"SUV" "Truck" "Sedan"});
read all var {MPG_City Origin Type Make Model};
close Sashelp.Cars;
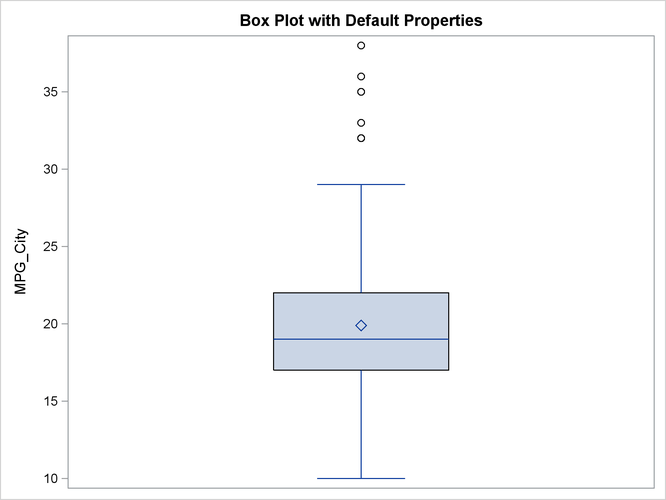
The following statements create a simple box plot of the MPG_City variable. The box plot is shown in Figure 15.4.
title "Box Plot with Default Properties";
call Box(MPG_City);
For a more complicated example, the following statements create a box plot by using the CATEGORY=, GRID=, LABEL=, DATALABEL=, and OPTION= options. The result is shown in Figure 15.5.
title "Category and Data Labels";
call Box(MPG_City) Category=Origin grid="y"
                   label={"Country of Origin" "MPG City"}
                   datalabel=putc(Model,"$10.") option="spread";
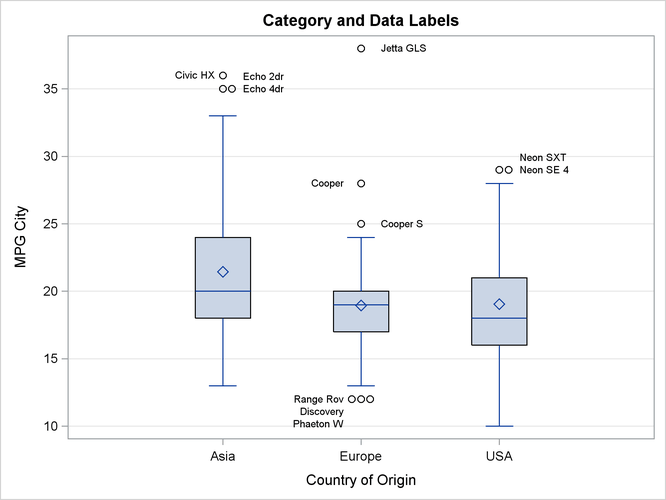
The following list explains the options that are used to create Figure 15.5:
-
The CATEGORY= option specifies a category variable. A box plot is created for each distinct value of the category variable. Figure 15.5 displays three box plots: one for vehicles that are manufactured in Asia, one for vehicles that are manufactured in Europe, and one for vehicles that are manufactured in the United States.
-
The GRID=option specifies whether grid lines are displayed for the X and Y axes. Figure 15.5 displays grid lines for the Y axis.
-
The LABEL= option specifies labels for the X and Y axes.
-
The DATALABEL= option specifies a vector of values that are used to label outliers. In Figure 15.5, the labels are the first 10 characters of the
Modelvariable in theSashelp.Carsdata set. -
The OPTION= option specifies options in the HBOX or VBOX statement. In this example, the SPREAD option is specified. This option has the effect, shown in Figure 15.5, of separating markers that would otherwise be overplotted.