Statistical Graphics
You can use the BAR subroutine
to create a bar chart. The required argument is a vector that contains values of a discrete variable. These values are used
to form the categories of a bar chart. The following statements read the Origin and Type variables from a subset of the Sashelp.Cars data set:
proc iml;
use Sashelp.Cars where(type ? {"SUV" "Truck" "Sedan"});
read all var {origin type};
close Sashelp.Cars;
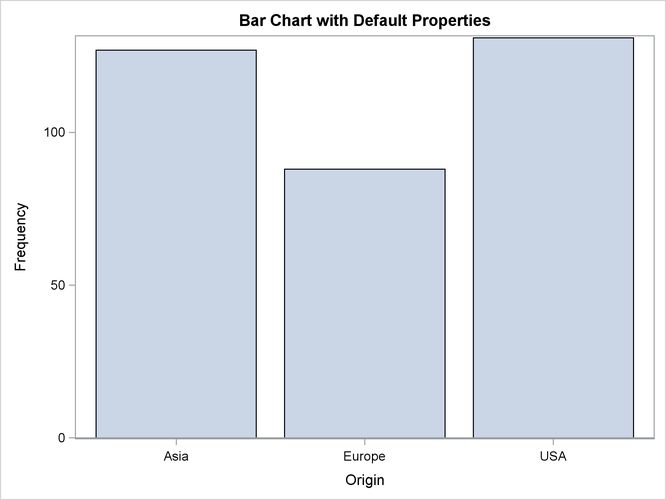
The following statements create a simple bar chart of the Origin variable, which is shown in Figure 15.2:
title "Bar Chart with Default Properties";
call Bar(origin);
For a more complicated example, the following statements create a bar chart by using the TYPE=, GROUP=, GROUPOPT=, GRID=, and LABEL= options. The result is shown in Figure 15.3.
title "Horizontal Bar Chart, group and order categories";
call Bar(origin) type="HBar" group=type groupopt="Cluster"
         grid="X" label="Origin";
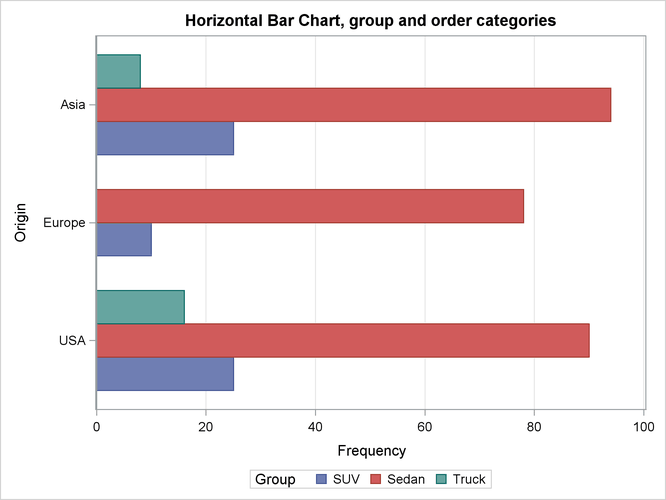
The following list explains the options that are used to create Figure 15.3:
-
The TYPE= option specifies whether to create a vertical bar chart or a horizontal bar chart. Figure 15.3 shows a horizontal bar chart.
-
The GROUP= option specifies a vector of values that determine groups in the plot. Figure 15.3 shows the bar chart grouped according to a subset of values for the
Typevariable. -
The GROUPOPT= option specifies a character vector of values that determine how groups are displayed. Figure 15.3 shows a clustered bar chart.
-
The GRID= option specifies whether grid lines are displayed for the X and Y axes. Figure 15.3 shows grid lines for the X axis.
-
The LABEL= option specifies axis labels for the X or Y axis. Figure 15.3 shows that the label "Origin" is used for the X axis.