| Calling Functions in the R Language |
Call R Graphics from PROC IML
R can create graphics in a separate window which, by default, appears on the same computer on which R is running. If you are running PROC IML and R locally on your desktop or laptop computer, you can display R graphics. However, if you are running client software that connects with a remote SAS server that is running PROC IML and R, then R graphics might be disabled.
The following statements describe some common scenarios for running a PROC IML program:
If you run PROC IML through a SAS Display Manager Session (DMS), you can create R graphics from your PROC IML program. The graph appears in the standard R graphics window.
If you run PROC IML through SAS Enterprise Guide, the display of R graphics is disabled because, in general, the SAS server (and therefore R) is running on a different computer than the SAS Enterprise Guide application.
If you run PROC IML from interactive line mode or from batch mode, then R graphics are disabled.
You can determine whether R graphics are enabled by calling the interactive function in the R language.
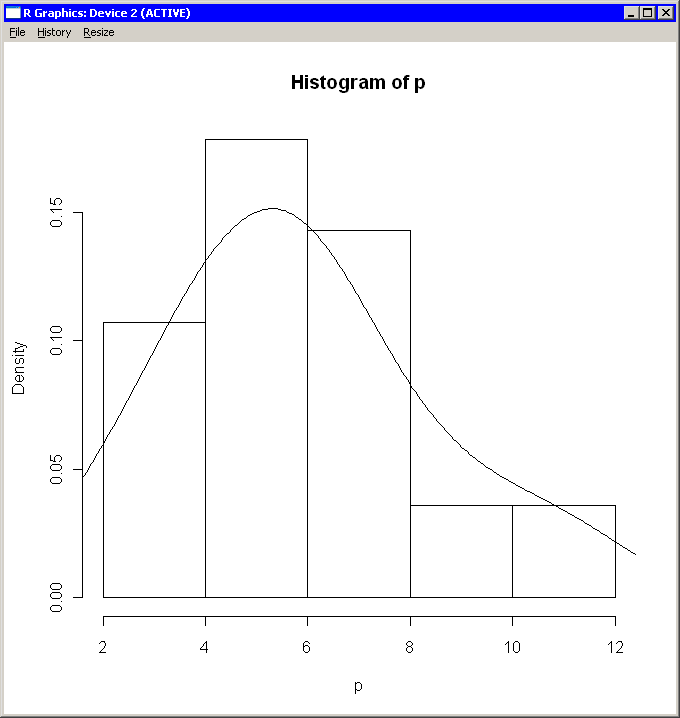
For example, the previous section used R to compute a kernel density estimate for some data. If you are running PROC IML through SAS DMS, you can create a histogram and overlay the kernel density estimate by using the following statements:
submit / R;
   hist(p, freq=FALSE) # histogram
   lines(est)          # kde overlay
endsubmit;
The hist function creates a histogram of the data in the p matrix, and the lines function adds the kernel density estimate contained in the est matrix. The R graphics window contains the histogram, which is shown in Figure 11.7.
Copyright © SAS Institute, Inc. All Rights Reserved.