Making the Appearance of Grouped Data Independent of Data Order
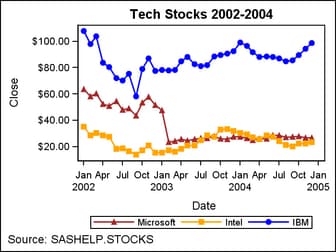
When unique
group values are gathered, they are internally recorded in the order
that they appear in the data. They are not subsequently sorted. This
means that if an input data source is modified, sorted, or filtered,
the order of the group values and their associations with GraphData1-GraphDataN
might change.
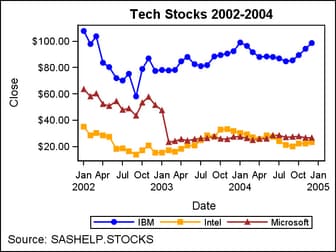
proc sort data=sashelp.stocks out=stocks;
   by date descending stock;
run;

ods listing style=stocks;

proc sgrender data= stocks template=group;
 where date between
       "1jan02"d and "31dec04"d;
run;
In many
cases, this might not be a problem because you really don't care which
line pattern, marker symbols, or colors are associated with particular
group values, but in some cases you might care. For example, if you
create many plots grouped by GENDER, you might want a consistent set
of visual properties for Females and Males across plots, regardless
of the input data order.
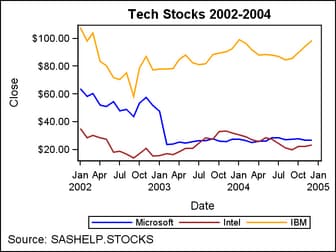
In our
example, you might want IBM to always have a blue color associated
with it. To enforce this kind of association, you need to modify the
input data by adding another numeric column that maps all group values
to a positive integer that corresponds to one of the GraphData1-GraphDataN
style elements. The name of the new variable can be anything.
data indexed;
  set sashelp.stocks;
  select (stock);
    when ("IBM")       ID=1;
    when ("Microsoft") ID=2;
    when ("Intel")     ID=3;
    otherwise;
  end;
run;
Now the
template needs to be modified by adding an INDEX=ID option. The DISPLAY=(MARKERS)
option was added to make sure that desired markers are also used.
proc template;
  define statgraph groupindex;
    begingraph;
      entrytitle "Tech Stocks 2002-2004";
      entryfootnote halign=left "Source: SASHELP.STOCKS";
      layout overlay;
        seriesplot x=date y=close / group=stock index=id
           name="series" lineattrs=(thickness=2) display=(markers) ;
        discretelegend "series";
      endlayout;
    endgraph;
  end;
run;
ods listing style=stocks;

proc sgrender data=indexed
              template=groupindex;
 where date between
      "1jan02"d and "31dec04"d;
run;