Using Custom Styles to Control the Appearance of Grouped Data
Each style
potentially can change the style attributes for GraphData1-GraphDataN.
If you have certain preferences for grouped data items, you can create
a modified style that will display your preferences. The following
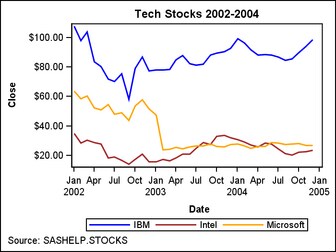
code creates a new style named STOCKS that is based on the supplied
style STYLES.LISTING. This modification changes the properties for
the GraphData1-GraphData3 style elements. All other style elements
are inherited from LISTING.
proc template;
  define style stocks;
    parent=styles.listing;
    style GraphData1 /
      ContrastColor=blue
      Color=lightBlue
      MarkerSymbol="CircleFilled"
      Linestyle=1;
    style GraphData2 /
      ContrastColor=brown
      Color=lightBrown
      MarkerSymbol="TriangleFilled"
      Linestyle=1;
    style GraphData3 /
      ContrastColor=orange
      Color=lightOrange
      MarkerSymbol="SquareFilled"
      Linestyle=1;
  end;
run;
In this
style definition, the LINESTYLE is set to 1 (solid) for the first
three data values. Style syntax requires that line styles be set with
their numeric value, not their keyword counterparts in GTL such as
SOLID, DASH, or DOT. See Values for Marker Symbols and Line Patterns for the complete
set of line styles.
CONTRASTCOLOR
is the attribute applied to grouped lines and markers. COLOR is the
attribute applied to grouped filled areas, such as grouped bar charts
or grouped ellipses. MARKERSYMBOL defines the same values that can
be specified with the MARKERATTRS=( SYMBOL=keyword ) option in GTL. See Values for Marker Symbols and Line Patterns for the complete
set of marker names.
After
the STOCKS style is defined, it must be requested on the ODS destination
statement. No modification of the compiled template is necessary:
ods listing style=stocks;

proc sgrender data=sashelp.stocks
              template=group;
 where date between
      "1jan02"d and "31dec04"d;
run;
One issue
you should be aware of is that the STOCKS style only customized the
appearance of the first three group values. If there were more group
values, other unaltered style elements will be used, starting with
GraphData4. Most styles define (or inherit) GraphData1 to GraphData12
styles elements. If you need more elements, you can add as many as
you desire, starting with one more than the highest existing element
(for example, GraphData13) and numbering them sequentially thereafter.