The LAYOUT OVERLAY Statement

The LAYOUT OVERLAY statement builds a 2D, single-cell graph by overlaying the results of the statements that are contained in the layout block. This layout is one of several possible layout containers in GTL. Other chapters provide detailed information on the other layout types. It is recommended that you learn about this type of layout first, because most of the other layout chapters contrast their feature sets with those of the OVERLAY layout.
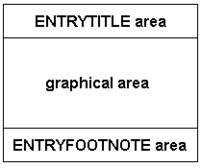
The outermost layout block of any template defines the content of the graphical area, which is represented in the following schematic:
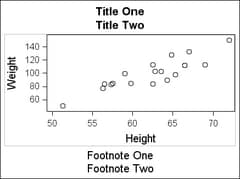
Title and Footnote Areas in a Graph
The graph in this next figure was defined by an OVERLAY layout with its border turned on. The layout contains a simple scatter plot. The boundaries of the layout container are shown by a light gray border. Everything within this border is managed by the layout.
Position of Titles and Footnotes in a Graph
The OVERLAY layout container controls
  • which statements (plot, legend, text) can be included in the layout block
  • which statements can be combined in the plot area bounded by the axes
  • various axis features
    • which axes are used (there are four available: X and Y, as well X2 and Y2)
    • which axis types are used (axis types are LINEAR, DISCRETE, LOG, and TIME )
    • axis label, axis data range, ticks, and tick values
    • other axis features such as offsets
  • border, padding, and background properties
  • positioning and alignment of all contained plots, text, legends, and nested layouts
  • default appearance of the generated plots ( CYCLEATTRS= option).
The layout container also queries the contained statements for options that might change the default internal rules for combining plots.