Example Program and Statement Details
Example Graph
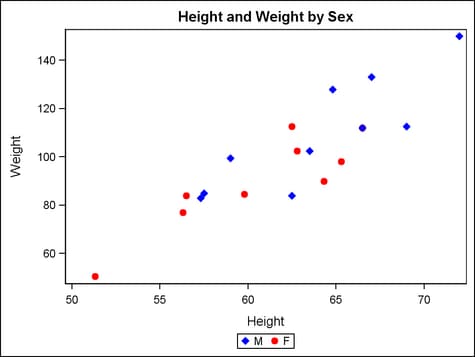
The following graph
was generated by the Example Program. The example
defines graphical properties to associate with classification values
in an input column that is used in a scatter plot. The DISCRETEATTRMAP
statement starts the attribute map definition, assigns a name to it,
and ensures that the data mapping is not case sensitive. The VALUE statements define the colors and marker symbols to associate
with the values M and F. The DISCRETEATTRVAR statement associates
the attribute map with the data column SEX and assigns the name GROUPMARKERS
to the association. The SCATTERPLOT statement references the named
association in its GROUP= option.
Example Program
proc template;
  define statgraph scatterplot;
    begingraph;
      entrytitle "Height and Weight by Sex";

      /* define the attribute map and assign the name "symbols" */
      discreteattrmap name="symbols" / ignorecase=true ;
        value "m" / markerattrs=(color=blue symbol=diamondfilled) ;
        value "f" / markerattrs=(color=red  symbol=circlefilled) ;
      enddiscreteattrmap ;

      /* associate the attribute map with input data column SEX and assign
       * the name GROUPMARKERS to the named association */
      discreteattrvar attrvar=groupmarkers var=sex attrmap="symbols" ;

      /* reference GROUPMARKERS in a plot statement */
      layout overlay;
        scatterplot x=height y=weight / name="scatter"
          group=groupmarkers ;
        discretelegend "scatter";
      endlayout;
    endgraph;
  end;

proc sgrender data=sashelp.class template=scatterplot;
run;
Statement Summary
The DISCRETEATTRMAP
statement creates an attribute map that matches graphical properties
to discrete values. The attribute map can be associated with a data
input column that is used as a classification variable in a graph.
Or it can be specified directly in a discrete legend.
Attribute maps can be
useful for ensuring that a particular value (a company name, for
example) is always represented by the same visual characteristics
in your graphs, regardless of the value’s order in the input data.
When specified directly in a discrete legend, an attribute map can
be used to display legend entries for group values that are not in
the data. (This point is discussed in more detail in a moment.)
Note: If you do not want to manage
the graphical properties that are associated with each unique discrete
value, you can simply specify an input column in the grouping option.
For example, in the Example Program, you can specify
input column SEX directly in the SCATTERPLOT statement’s GROUP=
option. In that case, each discrete value is still represented by
different graphical properties in the graph. The default properties
are derived from options that are set in the plot statement or from
the GraphData1 through GraphDataN style elements that are defined
in the ODS style that is in effect. However, to ensure that specific
graphical properties are used to represent a discrete value in the
graph, regardless of that value’s order in the data, you can
use an attribute map to create that association. Any values in the
data that are not accounted for in the attribute map are assigned
the graphical properties that they would receive if the attribute
map is not defined.
Defining and using a
discrete attribute map requires you to coordinate settings on several
statements:
-
Nest within the DISCRETEATTRMAP block at least one VALUE statement that specifies graphical properties to associate with a classification value. Use one VALUE statement for each classification value that you want to map.
-
Use the DISCRETEATTRVAR statement to create a named association between the defined attribute map and the input column that contains the classification values. The ATTRMAP= argument identifies the attribute map and the VAR= argument identifies the input column. Use the ATTRVAR= argument to assign a name that can be used to reference the named association in plot statements within the template.
-
In plot statements, reference the attribute map by specifying the name that is assigned in the DISCRETEATTRVAR statement’s ATTRVAR= argument. Each plot statement’s documentation in this reference indicates which options support an attribute map as the specified value.In a DISCRETELEGEND statement, you can reference the plot statement that uses the attribute map. The plot statement must have a NAME= option that assigns a name to the plot, and then the DISCRETELEGEND statement references that name. Because the attribute map is referenced in the plot statement, the legend uses the attribute map to represent the group values that are present in the data.
The DISCRETEATTRMAP
statement must be located within the BEGINGRAPH block but outside
of the outermost layout block. It cannot be nested in another DISCRETEATTRMAP
statement or in a RANGEATTRMAP statement. The DISCRETEATTRMAP block
must contain at least one VALUE statement. Values that are referenced
in the attribute map can be character or numeric. Discrete values
that are not accounted for in the attribute map are assigned the graphical
properties that they would receive if the attribute map is not defined.
Displaying
Legend Entries for Group Values That Are Not in the Data. To
display legend entries for the values in a grouped plot, you typically
use the plot statement’s NAME= option to assign a name to the
plot, and then reference that name in the DISCRETELEGEND statement.
In this usage case, the legend displays entries for the group values
that are present in the data. The legend does not display entries
for group values that are not present in the data.
To represent group values
in the legend, regardless of whether those values are present in the
data, you can define a discrete attribute map for all of the group
values that you want to represent. You can then specify the attribute
map directly in the DISCRETELEGEND statement. In this usage case,
the DISCRETELEGEND statement must also specify the TYPE= option to
identify the type of legend entries to display.
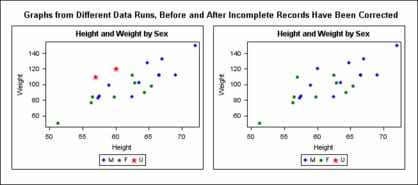
Referencing an attribute
map directly in a DISCRETELEGEND statement can be useful for flagging
data in the graph. For example, assume you have weight and height
values for all students in an analysis group, but some of the observations
are incomplete and do not record the student’s sex. In that
case, you could represent the unknown values by entering the value
U in the data. You could then define an attribute map that matches
string value “U” to specified graphical properties.
Reference the attribute map in your plot statement that the attribute
map is used in the plot. In the DISCRETELEGEND statement, do not reference
the plot statement. Instead, reference the attribute map directly.
As a result, the legend displays the attribute-map definitions. Observations
with value U for SEX are effectively flagged as incomplete observations. After
the problem records have been corrected, the absence of the flag in
the plot indicates that the value U is no longer present in the data,
so all records are now complete.
begingraph;
  entrytitle "Height and Weight by Sex";

  discreteattrmap name="symbols" / ignorecase=true trimleading=true;
    value "m" / markerattrs=(color=blue symbol=diamondfilled);
    value "f" / markerattrs=(color=green  symbol=circlefilled);
    value "u" / markerattrs=(color=red symbol=starfilled) ;
  enddiscreteattrmap;

  discreteattrvar attrvar=groupmarkers var=sex attrmap="symbols";

  layout overlay;
    scatterplot x=height y=weight / name="scatter"
      group=groupmarkers ;
    discretelegend "symbols" / type=marker ;
  endlayout;
endgraph;
Required Argument
assigns a name to the
attribute definition. The name can be referenced in a DISCRETEATTRVAR
statement, which is used to associate the attribute map with an input
data column. The name can also be referenced in a DISCRETELEGEND statement
to map the specified graphical properties directly to a discrete legend.