Example Program and Statement Details
Example Program
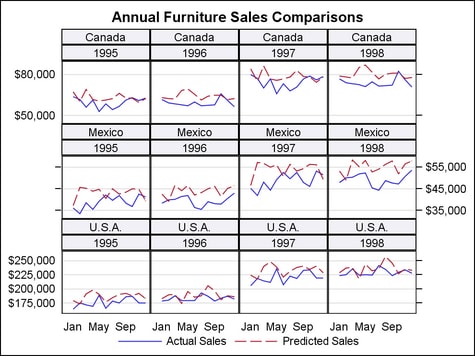
This example shows
how axis attributes can be managed separately for even and odd columns
and rows in the layout grid. In this case, the ROWAXISOPTS= option
is used to stagger the Y-axes attributes:
proc template;
 define statgraph layoutdatalattice;
  begingraph;
    entrytitle "Annual Furniture Sales Comparisons";
    layout datalattice rowvar=country columnvar=year /
      rowdatarange=union
      headerlabellocation=inside
      headerlabeldisplay=value
      headerbackgroundcolor=GraphAltBlock:color
      rowaxisopts=(griddisplay=on
        display=(tickvalues)
        altdisplay=(ticks)
        displaysecondary=(ticks)
        altdisplaysecondary=(ticks tickvalues)
        linearopts=(tickvalueformat=dollar12.))
      columnaxisopts=(display=(tickvalues)
        timeopts=(tickvalueformat=monname3.));
      layout prototype / cycleattrs=true;
        seriesplot x=month y=TotalActual / name="Actual";
        seriesplot x=month y=TotalPredict / name="Predict";
      endlayout;
      sidebar / align=bottom;
        discretelegend "Actual" "Predict" / border=false;
      endsidebar;
    endlayout;
  endgraph;
 end;
run;

proc summary data=sashelp.prdsal2 nway;
  class country year month;
  var actual predict;
  output out=prdsal2 sum=TotalActual TotalPredict;
run;

proc sgrender data=prdsal2 template=layoutdatalattice;
run;
Statement Summary
The LAYOUT DATALATTICE
and LAYOUT DATAPANEL statements each create a grid of graphs based
on the values of one or more classification variables. In the grid,
the axes are always external and displayed on the “primary”
axes by default. The axes that are considered primary depend on the
settings for the XAXIS= and YAXIS= options in plot statements that
are specified within the LAYOUT PROTOTYPE. For managing the primary
axes, both the LAYOUT DATALATTICE and LAYOUT DATAPANEL statements
have COLUMNAXISOPTS=, COLUMN2AXISOPTS=, ROWAXISOPTS=, and ROW2AXISOPTS=
options that manage the axis features separately for columns and rows.
The settings that are available can manage odd and even columns and
rows separately, enabling you to simplify the axis display within
the grid.
The following table
shows which axis is primary for the XAXIS= and YAXIS= settings, and
which axis option to use to manage that primary axis.
The settings that
are available for the axis options can manage odd and even columns
and rows separately, enabling you to simplify the axis display within
the grid.
-
To manage the first, third, and odd occurrences of a primary axis, use the DISPLAY= option.
-
To manage the second, fourth, and even occurrences of a primary axis, use the ALTDISPLAY= option.
You can also display
“secondary” axes in the grid. A secondary axis is not
an independent axis. Rather, it mirrors the primary axis, but it is
displayed on the opposite side and can have different display options.
For example, when the X axis (bottom) is primary, you can mirror that
axis with a secondary X axis at the top of the grid. Similarly, when
the Y2 axis (right) is primary, you can mirror that axis with a secondary
Y2 axis on the left of the grid. A secondary axis makes it easier
to interpolate values in the cells that are farthest away from the
primary axis.
Secondary axes can be
displayed in the graph, provided all plot statements in the LAYOUT
PROTOTYPE map data to the same primary axis. For example, a secondary
X axis can be displayed at the top of the layout, provided all plot
statements set XAXIS=X to map data to the primary X axis (bottom).
Similarly, a secondary Y2 axis can be displayed to the left in the
layout, provided all plot statements set YAXIS=Y2 to map data to the
primary Y2 axis (right). If all plot statements in the LAYOUT PROTOTYPE
do not map data to the same primary axis, the secondary axes are not
displayed.
To display secondary
axes in the grid, use the DISPLAYSECONDARY= and ALTDISPLAYSECONDARY= options. As with the options for
the primary axes, the DISPLAYSECONDARY= option manages the first,
third, and odd occurrences of a secondary axis. The ALTDISPLAYSECONDARY=
option manages the second, fourth, and even occurrences of a secondary
axis.
In the default cases
for the plots within the layout, the axis type is always DISCRETE,
LINEAR, or TIME. The TYPE= option enables you to specify an
axis type that overrides the default. For example, when appropriate
for the data, you can request a LOG axis. When you override the default
axis type, you must be sure to specify the correct axis type for the
plot(s) that you are defining.
Each axis type has features
specific to that type, and the following axis options enable you to
specify features for the different types: DISCRETEOPTS= , LINEAROPTS= , LOGOPTS= , and TIMEOPTS= . One or more of these options can
be specified for an axis, but the specified settings are applied only
to the axis type that supports them.
General Options for All Axes in the Layout
The options that are
documented in this section can be used with any of the axis types
that are supported within a DATALATTICE or DATAPANEL layout. Subsequent
sections in the chapter document the axis options that are available
only for specific axis types: discrete, linear, log, or time axes.
controls which axis
features are displayed on second, fourth, and other even row or column
occurrences of the primary axis. For more information about the primary
and secondary axes, see Statement Summary.
a list of space-delimited
options, enclosed in parentheses. The list must include one or more
of the following:
| LABEL | Displays the axis label. A common label is displayed at the center of the grid, and the label applies to all the primary axes in the row or column. This label is overridden by a label specified on the DISPLAY= option. |
| LINE | Displays the axis line. |
| TICKS | Displays the tick marks. |
| TICKVALUES | Displays the values that are represented by the major tick marks. |
The default line attributes
for the axis line and axis tick marks are defined in the GraphAxisLine
style element.
controls which features
are displayed on second, fourth, and other even row or column occurrences
of the secondary axis. For more information about the primary and
secondary axes, see Statement Summary.
a list of space-delimited
options, enclosed in parentheses. The list must include one or more
of the following:
| LABEL | Displays the axis label. A common label is displayed at the center of the grid, and the label applies to all the secondary axes in the row or column. This label is overridden by a label specified on the DISPLAY= option. |
| LINE | Displays the axis line. |
| TICKS | Displays the tick marks. |
| TICKVALUES | Displays the values that are represented by the major tick marks. |
The default line attributes
for the axis line and axis tick marks are defined in the GraphAxisLine
style element.
Restriction: A
secondary axis is not an independent axis. Rather, it mirrors the
primary axis (though it can use different display features). Thus,
for this option to take effect, all plot statements in the LAYOUT
PROTOTYPE must map data to the same primary axis. For example, a secondary
X2 axis can be displayed on top in the layout, provided all plot statements
set XAXIS=X to map data to the primary X axis (bottom). Similarly,
a secondary Y2 axis can be displayed to the right in the layout, provided
all plot statements set YAXIS=Y to map data to the primary Y axis
(left). If some plot statements set XAXIS=X and others set XAXIS=X2,
both the X and X2 axis are primary and a secondary X axis cannot be
displayed. In that case, this option is ignored. The same applies
for the Y axes.
specifies one or more
options for a discrete axis. See Options for Discrete Axes.
controls which axis
features are displayed on first, third, and other odd row or column
occurrences of the primary axis. For more information about the primary
and secondary axes, see Statement Summary.
a list of space-delimited
options, enclosed in parentheses. The list must include one or more
of the following:
| LABEL | Displays the axis label. A common label is displayed at the center of the grid, and the label applies to all the primary axes in the row or column. This label overrides a label specified on the ALTDISPLAY= option. |
| LINE | Displays the axis line. |
| TICKS | Displays the tick marks. |
| TICKVALUES | Displays the values that are represented by the major tick marks. |
controls which axis
features are displayed on first, third, and other odd row or column
occurrences of the secondary axis. For more information about the
primary and secondary axes, see Statement Summary.
a list of space-delimited
options, enclosed in parentheses. The list must include one or more
of the following:
| LABEL | Displays the axis label. A common label is displayed at the center of the grid, and the label applies to all the secondary axes in the row or column. This label overrides a label specified on the ALTDISPLAYSECONDARY= option. |
| LINE | Displays the axis line. |
| TICKS | Displays the tick marks. |
| TICKVALUES | Displays the values that are represented by the major tick marks. |
Restriction: A
secondary axis is not an independent axis. Rather, it mirrors the
primary axis (though it can use different display features). Thus,
for this option to take effect, all plot statements in the LAYOUT
PROTOTYPE must map data to the same primary axis. For example, a secondary
X2 axis can be displayed on top in the layout, provided all plot statements
set XAXIS=X to map data to the primary X axis (bottom). Similarly,
a secondary Y2 axis can be displayed to the right in the layout, provided
all plot statements set YAXIS=Y to map data to the primary Y axis
(left). If some plot statements set XAXIS=X and others set XAXIS=X2,
both the X and X2 axis are primary and a secondary X axis cannot be
displayed. In that case, this option is ignored. The same applies
for the Y axes.
specifies the attributes
of the grid lines. See General Syntax for Attribute Options for the syntax
on using a style-element and Line Options for available line-options.
Interaction: For
this option to have any effect, the grid lines must be enabled by
the ODS style or the GRIDDISPLAY= option.
specifies whether axis
grid lines are displayed.
specifies that grid
lines are not displayed unless the GraphGridLines element in the current
style contains DisplayOpts="ON."
This option enables
the template to absolutely control the display of grid lines or to
allow interaction with the current style to decide whether grid lines
are displayed.
Supplied styles use
DisplayOpts="AUTO," which means that the style has no "preference"
about grid lines and the graphics template setting for grid lines
is always used.
Discussion: The
following table shows the end results for various combinations of
the GRIDDISPLAY= option and the DisplayOpts= attribute of the GraphGridLines
style element. Most supplied templates use the default setting AUTO_OFF
to indicate a preference for not displaying grid lines, but allowing
the style to override.
specifies the axis
label. The string can be either
a string literal or a dynamic. The list form implies that all included
string literals or dynamics will be concatenated
Default: The
default label is derived from the primary plot in the layout. For
more information, see When Plots Share Data and a Common Axis.
Interaction: If
the axis label is too long to fit along the axis, it is truncated
by default. Use the SHORTLABEL= option to specify an alternate axis
label to be used whenever truncation would normally occur.
Interaction: For
this option to have any effect, the axis label must be enabled by
the ODS style or the DISPLAY= or DISPLAYSECONDARY= option.
specifies the color
and font attributes of the axis label. See General Syntax for Attribute Options for the syntax
on using a style-element and Text Options for available text-options.
Interaction: For
this option to have any effect, the axis label must be enabled by
the ODS style or the DISPLAY= or DISPLAYSECONDARY= option.
specifies one or more
linear axis options for a numeric interval axis. See Options for Linear Axes Only.
specifies one or more
options for a log axis. See Options for Log Axes Only.
assigns a name to an
axis for reference in other statements. Currently, it is used only
in an AXISLEGEND statement.
Interaction: This
option is ignored unless the axis is discrete. The axis can be discrete
by default, or explicitly set to discrete with a TYPE=DISCRETE setting.
Interaction: For
this option to take effect, an axis legend must be enabled. To enable
an axis legend, the DISCRETEOPTS= option must set the TICKVALUEFITPOLICY
to either EXTRACT or EXTRACTALWAYS. In addition, an AXISLEGEND statement
must be specified to generate the axis legend.
reserves an area at
the maximum end of the axis. No tick marks are displayed in the reserved
area. For more information, see Adjusting Axis Offsets.
reserves an area at
the minimum end of the axis. No tick marks are displayed in the reserved
area. For more information, see Adjusting Axis Offsets.
specifies an alternate
axis label. This label is used when the default axis label or label
specified by the LABEL= option is too long for the grid length
or the grid width.
Interaction: For
this option to have any effect, the axis label must be enabled by
the ODS style or the DISPLAY= or DISPLAYSECONDARY= option.
specifies the color
and font attributes of the axis tick value labels. See General Syntax for Attribute Options for the syntax
on using a style-element and Text Options for available text-options.
Interaction: For
this option to have any effect, the tick values must be enabled by
the ODS style or the DISPLAY= or DISPLAYSECONDARY= option.
specifies one or more
options for a time axis. See Options for Time Axes Only.
specifies the type
of axis to use.
Use a DISCRETE axis
if possible. The data for discrete axes can be character or numeric.
You can add a DISCRETEOPTS= ( ) option list to customize this
axis type.
Use a LINEAR axis if
possible. You can add a LINEAROPTS= ( ) option list to customize this
axis type.
Use a TIME axis if
possible. Data for this axis must be SAS time, SAS date, or SAS datetime
values. You can add a TIMEOPTS= ( ) option list to customize this
axis type.
Interaction: If
this option is set to anything other than AUTO, plots within the layout
are dropped from the display if their data types or data ranges do
not match the axis type requirements. For more information, see Plot Axis Types Must Agree on Common Axes.
Interaction: After
the axis type is determined (whether you set a specific type or AUTO
is in effect), only options supported by that axis type can be used.
For example, if TYPE=TIME, only the general OVERLAY axis options and
those available on TIMEOPTS= are supported.
Options for Discrete Axes
specifies one or more
options for a discrete axis. Options must be enclosed in parentheses.
Each option is specified as a name = value pair
and each pair is space separated.
specifies a policy
for avoiding tick value collision.
The collision-avoidance
policy that is most effective depends on the number of tick values,
their length, and the length of the axis. The policy can be one of
the following:
| NONE | Do not attempt to fit ticks that collide. This value is not available for an X or X2 axis. |
| ROTATE | Tick values are rotated 45 degrees. This value is not available for a Y or Y2 axis. |
| THIN | Some tick values are removed. |
| ROTATETHIN | Attempt ROTATE policy and then THIN policy. This value is not available for a Y or Y2 axis. |
| STAGGER | Tick values alternate between two rows. This value is not available for a Y or Y2 axis. |
| STAGGERROTATE | Attempt STAGGER policy and then ROTATE policy. This value is not available for a Y or Y2 axis. |
| STAGGERTHIN | Attempt STAGGER policy and then THIN policy. This value is not available for a Y or Y2 axis. |
| STAGGERTRUNCATE | Attempt STAGGER policy and then TRUNCATE policy. This value is not available for a Y or Y2 axis. |
| TRUNCATE | Tick values are shortened when they exceed a certain number of characters. This value is not available for a Y or Y2 axis. |
| TRUNCATEROTATE | Attempt TRUNCATE policy and then ROTATE policy. This value is not available for a Y or Y2 axis. |
| TRUNCATESTAGGER | Attempt TRUNCATE policy and then STAGGER policy. This value is not available for a Y or Y2 axis. |
| TRUNCATETHIN | Attempt TRUNCATE policy and then THIN policy. This value is not available for a Y or Y2 axis. |
| EXTRACT | Instead of actual tick values, display consecutive integers along the axis to represent those tick values. (See the Requirement for additional information.) In most cases, this policy is implemented if the system estimates that a collision might occur. If no collision occurs, the actual tick values are displayed on the axis in the normal manner. |
| EXTRACTALWAYS | Same as EXTRACT, except that the extraction is implemented regardless of whether collision occurs. |
Requirement: The
EXTRACT and EXTRACTALWAYS policies must be used in conjunction with
an AXISLEGEND statement. The AXISLEGEND statement creates a legend
that correlates the actual tick values with the consecutive integers
that are displayed as axis-tick values in the graph. The AXISLEGEND
statement must reference this axis, using the name that is assigned
to the axis in its NAME= axis option.
Options for Linear Axes Only
specifies that evenly
spaced integer values are used for tick marks.
Interaction: This
option overrides the MAXDECIMALS= and PREFERREDDECIMALS= suboptions
of the TICKVALUEFORMAT= option
specifies a bias for
including one more tick mark at the maximum end of the axis. For more
information, see Adjusting Axis Thresholds.
specifies a bias for
including one more tick mark at the minimum end of the axis. For more
information, see Adjusting Axis Thresholds.
specifies a policy
for avoiding tick value collision. Only the default setting (THIN)
is available for a Y or Y2 axis.
If more than one policy
is used, the values in the list are formatted according to the TICKVALUEFORMAT=
option.
| THIN | Eliminate alternate tick values. Only available on COLUMNAXIS. |
| ROTATE | Tick values are rotated 45 degrees. |
| ROTATETHIN | Attempt ROTATE policy and then THIN policy. |
| STAGGER | Tick values alternate between two rows. |
| STAGGERROTATE | Attempt STAGGER policy and then ROTATE policy. |
| STAGGERTHIN | Attempt STAGGER policy and then THIN policy. |
specifies how to format
the values for major tick marks.
specifies one or more
major tick value formatting options. Together, these options provide
parameters for determining an optimal format (w.d,
Ew., BESTw.)
for displaying major tick values.
| MAXWIDTH = integer | Specifies the maximum width for displayed tick values. Values might be rounded or converted to E notation to fit into this width. |
| MAXDECIMALS = integer | Specifies the maximum number of decimals for displayed tick values. Values might be rounded or converted to E notation to fit into this width. MAXWIDTH > MAXDECIMALS |
| PREFERREDDECIMALS = integer | Specifies the number of decimal places desired for most values. The actual number might vary based on other constraints. |
| EXTRACTSCALE = boolean | Specifies whether to extract a scale factor from the tick values and use it to reduce the tick value width. For large tick values, the scale factor is set to ensure that the absolute value of the largest value is greater than 1. The scale can be millions, billions, or trillions for values of 999 trillion or less, or a multiple of 10 (denoted as 10^n) for values over 999 trillion. For small fractional tick values, the scale factor is set to ensure that the absolute value of the smallest value is greater than 1. The scale can be millionth, billionth, or trillionth for values of 1 trillionth or more, or a multiple of 1/10 (10^–n) for values less than 1 trillionth. The scale used is appended to the axis label. For example: Total Sales (millions). |
Restriction: GTL
currently honors most but not every SAS format. For details, see SAS Formats Not Supported.
specifies the tick
values for a linear axis as list.
Default: An
internal algorithm determines the tick marks based on the actual axis
data range or the data range established by the VIEWMIN= and VIEWMAX= options. By default, when this option
is used, only tick values that appear are those in numeric-list that
fall within the explicit data range (set by VIEWMIN= and VIEWMAX=)
or implicit data range (set by the actual data minimum and data maximum).
Interaction: This
option is ignored if the TICKVALUESEQUENCE= option is specified, or if the tick
values are not enabled by the ODS style or the DISPLAY= or DISPLAYSECONDARY= option.
Interaction: The VIEWMIN= and VIEWMAX= options alter the axis data range.
If the VIEWMIN= option is set to the minimum tick list value and the
VIEWMAX= option is set to the maximum tick list value, all ticks in
the tick list are displayed. This might result in some data not being
displayed. For example, data might not be displayed when the VIEWMIN=
value is greater than the actual data minimum, or when the VIEWMAX=
value is less than actual data maximum.
Interaction: If
the TICKVALUEPRIORITY= is set to TRUE, 1) the VIEWMIN= and
VIEWMAX= options are ignored if they are fully enclosed by the numeric-list 2)
the tick numeric-list can extend
the implicit data range of the axis, but never reduce it.
The values in the
list are formatted according to the setting for the TICKVALUEFORMAT= option.
specifies whether an
axis tick specification (TICKVALUELIST= or TICKVALUESEQUENCE=) can
extend the axis data range.
Interaction: For
this option to have any effect, the tick marks must be enabled by
the ODS style or the DISPLAY= or DISPLAYSECONDARY= option.
specifies the tick
values for a linear axis by start, end, and increment.
Default: An
internal algorithm determines the tick marks based on the actual axis
data range or the data range established by the VIEWMIN= and VIEWMAX= options. By default when this option
is used, the only tick values to appear are those that fall within
the explicit data range (set by VIEWMIN= and VIEWMAX=) or implicit
data range (set by the actual data minimum and data maximum).
Three options that
control major tick values. All three options must be provided.
| START = number | Specifies the value for the first tick mark. |
| END = number | Specifies the value for the last tick mark. |
| INCREMENT = number | Specifies the increment for intermediate tick marks between the first and last tick marks. The END value always controls the last tick mark. The interval between the last tick mark and the previous tick mark might not necessarily be the INCREMENT value. |
Interaction: The
VIEWMIN= and VIEWMAX= options alter the axis data range. If the VIEWMIN=
option is set to the START= option value and the VIEWMAX= option is
set to the END= option value, all ticks in the tick sequence are displayed.
Interaction: If
the TICKVALUEPRIORITY= option is set to TRUE, the tick sequence
might extend the explicit data range of the axis, but never reduce
it.
Interaction: For
this option to have any effect, the tick marks must be enabled by
the ODS style or the DISPLAY= or DISPLAYSECONDARY= option.
The values in the
sequence are formatted according to the setting for the TICKVALUEFORMAT= option.
specifies the maximum
data value to include in the display (the value might be adjusted
by the threshold calculation). For more information, see Adjusting the Axis View.
Interaction: This
option does not determine the maximum axis tick value displayed. The THRESHOLDMAX= value is used to determine the maximum
tick value.
specifies the minimum
data value to include in the display (the value might be adjusted
by the threshold calculation). For more information, see Adjusting the Axis View.
Interaction: This
option does not determine the minimum axis tick value displayed. The THRESHOLDMIN= value is used to determine the maximum
tick value.
Options for Log Axes Only
specifies whether minor
ticks are displayed:

Restriction: Minor
ticks can be displayed only when BASE=10 and TICKINTERVALSTYLE= is LOGEXPAND or LOGEXPONENT.
specifies how to scale
and format the values for major tick marks.
Restriction: For
LOGEXPAND and LOGEXPONENT, formats on data columns contributing to
the axis are ignored. For LINEAR, ticks values are automatically formatted
when the column format is not assigned or one of w.d, Ew.,
or BESTw. Other formats (SAS
defined or user-defined) are used if specified.
Restriction: GTL
currently honors most but not every SAS format. For details, see SAS Formats Not Supported.
If you use TICKINTERVALSTYLE=LOGEXPONENT,
you might want to include information in the axis label about which
base is used.
A LOGEXPAND, LOGEXPONENT,
or LINEAR representation is chosen automatically based on the range
of the data. When the data range is small (within an order of magnitude),
a LINEAR representation is typically used. Data ranges that encompass
several orders of magnitude typically use the LOGEXPAND or LOGEXPONENT
representation.


Restriction: For
LOGEXPONENT, formats on data columns contributing to the axis are
ignored. For LOGEXPAND, formats on data columns contributing to the
axis are ignored, although any "named format" on the column is retained.
For LINEAR, ticks values are automatically formatted when the column
format is not assigned or one of w.d, Ew.
or BESTw. Other formats (SAS
defined or user-defined) are used if specified.
Restriction: GTL
currently honors most but not every SAS format. For details, see SAS Formats Not Supported.
specifies the maximum
data value to include in the display. For more information, see Adjusting the Axis View.
specifies the minimum
data value to include in the display. For more information, see Adjusting the Axis View.
Options for Time Axes Only
specifies one or more
options for a time axis.
Variables associated
with a time axis must be in SAS time, SAS date, or SAS datetime units
and have an associated SAS time, date, or datetime format.
specifies the time
interval between major ticks. Valid interval keywords
are AUTO, SECOND, MINUTE, HOUR, DAY, TENDAY, WEEK, SEMIMONTH, MONTH,
QUARTER, SEMIYEAR, YEAR.
The data column(s)
mapped to a time axis must be in the same duration units: TIME, DATE,
or DATETIME. The selection of an interval must be consistent with
the duration unit. For example, if the data are in time units, you
can select only AUTO, SECOND, MINUTE, HOUR.
Default: AUTO.
An appropriate interval is chosen based on the data and the column
date/datetime/time format.
specifies whether minor
ticks are displayed.
Interaction: This
option is ignored if the TICKVALUELIST= option is used or if the tick marks
are not enabled by the DISPLAY= or DISPLAYSECONDARY= option.
specifies whether to
split the tick values on an X or X2 axis, if possible. This option
is not available for a Y or Y2 axis. For example, with INTERVAL= MONTH, this is how tick values are split:
typically, fewer tick
values fit, causing thinning, rotation, or staggering of the values.
See the TICKVALUEFITPOLICY= option.
specifies a policy
for avoiding tick value collision on an X or X2 axis. This option
is not available for a Y or Y2 axis.
The collision-avoidance
policy that is most effective depends on the number of tick values,
their length, and the length of the axis. For an X or X2 axis, the
policy can be one of the following:
| THIN | Some tick values are removed. |
| ROTATE | Tick values are rotated 45 degrees. |
| ROTATETHIN | Attempt ROTATE policy and then THIN policy. |
| STAGGER | Tick values alternate between two rows. |
| STAGGERROTATE | Attempt STAGGER policy and then ROTATE policy. |
| STAGGERTHIN | Attempt STAGGER policy and then THIN policy. |
specifies how to format
the values for major tick marks.
Default: The
default format used by the INTERVAL= option. The default does not apply
if TICKVALUELIST= is specified.
A SAS date, time, or
datetime format to control how the major tick values are displayed.
This format must be in the same duration units as the data column(s)
mapped to a time axis: TIME, DATE, or DATETIME and should be appropriate
for the value of the INTERVAL= option. For example, if INTERVAL=MONTH
and there are two years of data displayed on the axis, choosing TICKVALUEFORMAT=YEAR.
would result in several ticks having the same year value.
Restriction: GTL
currently honors most but not every SAS format. For details, see SAS Formats Not Supported.
specifies the tick
values for a time axis as list.
Requirement: The
list must be enclosed in parentheses and each item separated by a
blank. The items in the list must be in the same duration units as
the data mapped to the axis: TIME, DATE, or DATETIME. The values can
be expressed as SAS TIME, DATE, or DATETIME constants (for example,
"13:23"T, "11MAY06"D, or "11MAY06:13:23"DT) or their numeric equivalents.
Restriction: This
option does not extend the data range of the axis. If the values fall
within the default data range or that specified by the VIEWMIN= or VIEWMAX= options, they are used.
The values in the
list are formatted according to the setting for the TICKVALUEFORMAT= option. If TICKVALUEFORMAT= is not
used, the values are formatted according to the column format (the
default TICKVALUEFORMAT value is not applied to these values).
specifies the maximum
data value to include in the display. For more information, see Adjusting the Axis View.
specifies the minimum
data value to include in the display. For more information, see Adjusting the Axis View.