Example Program and Statement Details
Example Graph
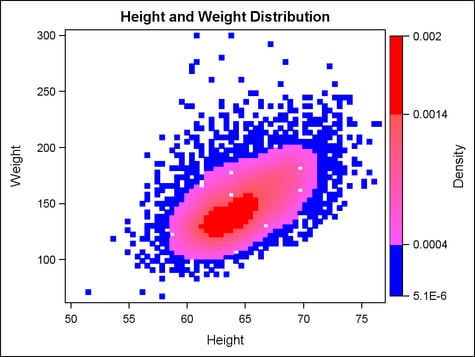
The following graph
was generated by the Example Program. The example
defines colors to associate with data ranges in an input column that
is used in a scatter plot. The RANGEATTRMAP statement starts the attribute
map definition and assigns a name to it. The RANGE statements define the value ranges and the colors to associate
with those ranges. The highest value specified, 0.002, does not have
to be an actual value in the data. The RANGEATTRVAR statement associates the attribute
map with the data column DENSITY and assigns the name RANGEVAR to
the association. The SCATTERPLOT statement references the named association
in its MARKERCOLORGRADIENT= option.
Example Program
proc template;
define statgraph attrmap;
  begingraph;
    entrytitle "Height and Weight Distribution" ;

    /* define the attribute map and assign the name "densityrange" */
    rangeattrmap name="densityrange" ;
      range MIN - 0.0004     / rangealtcolor=blue ;
      range 0.0004 < - 0.0014 / rangealtcolormodel=(lightpurple lightred) ;
      range 0.0014 < - 0.002  / rangealtcolor=red ;
    endrangeattrmap ;

    /* associate the attribute map with 	input data column DENSITY and
     * assign variable name RANGEVAR to the named association */
    rangeattrvar attrvar=rangevar var=density attrmap="densityrange" ;

    /* reference the RANGEVAR attribute map in a plot statement */
    layout overlay;
      scatterplot x=height y=weight / markercolorgradient=rangevar
        markerattrs=(symbol=squarefilled size=6px) name="scatter";
      continuouslegend "scatter" / orient=vertical
        halign=right title="Density";
    endlayout;
  endgraph;
end;

proc sgrender data=sashelp.gridded(where=(count>0)) template=attrmap;
run;
Statement Summary
The RANGEATTRMAP statement
creates an attribute map that matches colors to numeric values or
value ranges. The attribute map can be associated with a data input
column that uses color to represent response values in a graph. Attribute
maps can be useful for controlling the application of gradient color
in a graph. In addition, they enable you to map color to data values,
independent of the actual data that is used in the graph. For example,
for temperature data, you can set Blue for 0 and Red for 100, even
if the values 0 and 100 are not in the data.
Defining and using the
attribute map requires you to coordinate settings on several statements:
-
Nest within the RANGEATTRMAP block at least one RANGE statement that specifies a numeric value or numeric range and the color to associate with that value or range. Use one RANGE statement for each value range that you want to map. You can use keywords like MIN and MAX in the range specification. For complete details about the range specifications, see the RANGE statement.
-
Use the RANGEATTRVAR statement to create a named association between the defined attribute map and the input column that contains the numeric values. The ATTRMAP= argument identifies the attribute map and the VAR= argument identifies the input column. Use the ATTRVAR= argument to assign a name that can be used to reference the named association in plot statements within the template.
-
Reference the attribute variable in one or more plot statements by specifying the name that is assigned in the RANGEATTRVAR statement’s ATTRVAR= argument. Each plot statement’s documentation in this reference indicates which options support an attribute variable as the specified value.In a CONTINUOUSLEGEND statement, reference the plot statement that uses the attribute map. The plot statement must have a NAME= option that assigns a name to the plot, and then the CONTINUOUSLEGEND statement references that name. Because the attribute map is referenced in the plot statement, the legend uses that attribute map to represent the numeric values that are present in the data.
The RANGEATTRMAP statement
must be located within the BEGINGRAPH block but outside of the outermost
layout block. It cannot be nested in another RANGEATTRMAP statement
or in a RANGEATTRMAP statement. The RANGEATTRMAP block must contain
at least one RANGE statement. All values that are referenced
in the attribute map must be numeric. Data values that are not accounted
for in the attribute map receive the default color from the GraphOther,
GraphOverflow, or GraphUnderflow style element, depending on where
the unassigned values are relative to the specified data ranges.