Example Program and Statement Details
Example Program
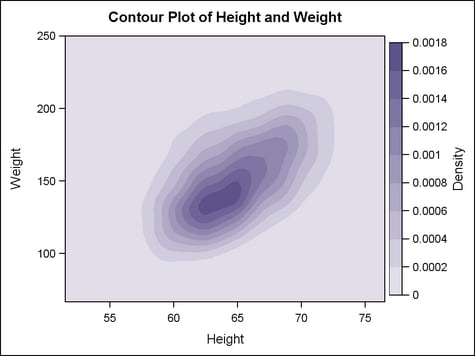
proc template;
 define statgraph contourplotparm;
   begingraph;
     entrytitle "Contour Plot of Height and Weight";
     layout overlay /
         xaxisopts=(offsetmin=0 offsetmax=0
           linearopts=(thresholdmin=0 thresholdmax=0))
         yaxisopts=(offsetmin=0 offsetmax=0
           linearopts=(viewmax=250
                       thresholdmin=0 thresholdmax=0));
       contourplotparm x=height y=weight z=density /
         contourtype=fill nhint=12
           name="Contour" colormodel=twocolorramp;
       continuouslegend "Contour" / title="Density";
     endlayout;
   endgraph;
 end;
run;
proc sgrender data=sashelp.gridded template=contourplotparm;
run;
Statement Summary
A CONTOURPLOTPARM statement
uses the CONTOURTYPE= option to specify the type of contour
plot to generate. Contour types that display fills or gradients but
no contour lines can use only a CONTINUOUSLEGEND statement to represent
the contour level values in a legend. Contour types that display lines
can use either a CONTINUOUSLEGEND or DISCRETELEGEND statement to identify
contour level values.
By default, the CONTOURPLOTPARM
statement assumes that the X-Y grid is complete. If the grid is not
complete, then set the GRIDDED= option to FALSE so that the plot
calculates the values needed to complete into a grid with a bounding
rectangle.
For filled or gradient
contour types, small gaps might be visible between the axes and the
bounding box of the contour data. To eliminate these gaps, set the
axis options of the LAYOUT OVERLAY statement as follows:
Options
|
Specifies whether to
reverse the gradient defined by the COLORMODEL= option.
|
|
specifies a style element
that is used to determine the colors of filled or gradient contours.
Name of a style element.
The style element can contain these style attributes:
| STARTCOLOR | Specifies a color for the smallest data value of the Z variable. |
| NEUTRALCOLOR | Specifies a color for the midpoint of the range of the Z variable. |
| ENDCOLOR | Specifies a color for the highest data value of the Z variable. |
Interaction: The REVERSECOLORMODEL= option can be used to reverse the
start and end colors of the ramp assigned to the color model.
CONTOURTYPE= LINE | LABELEDLINE | FILL | GRADIENT | LINEFILL
| LINEGRADIENT | LABELEDLINEFILL | LABELEDLINEGRADIENT
specifies how the contour
is displayed.
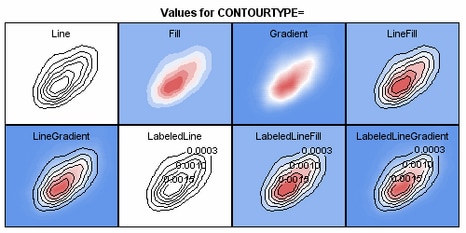
displays the area between
the contour levels as filled. Each contour interval is filled with
one color.
combines the LINE and
FILL types. Each contour interval is filled with one color. Displays
contour levels as unlabeled lines.
Interaction: The fill colors of the types that enable FILL or GRADIENT are controlled
by the COLORMODEL= option.
Interaction: The line properties of the types that enable LINE or LABELEDLINE
are controlled by the LINEATTRS= option.
Interaction: The label properties of the types that enable LABELEDLINE are controlled
by the LINELABELATTRS= and LINELABELBASELINE= options.
Interaction: If a DISCRETELEGEND statement is associated with the contour, the
legend is NOT displayed if CONTOURTYPE= is set to FILL or GRADIENT.
specifies whether the
grid formed by the X and Y values is complete.
For information about
the algorithm used to calculate the grid, see “Mesoscale Objective
Map Analysis Using Weighted Time-Series Observations.”(footnote1)
specifies the attributes
of the contour lines. See General Syntax for Attribute Options for the syntax
on using a style-element and Line Options for available line-options.
specifies the color
and font attributes of the contour line labels. See General Syntax for Attribute Options for the syntax
on using a style-element and Text Options for available text-options.
specifies that the
data columns for this plot and the plot type be used for determining
default axis features.
Details: This option is needed only when two or more plots within an overlay-type
layout contribute to a common axis. For more information, see When Plots Share Data and a Common Axis .
specifies whether to
reverse the gradient (color ramp) defined by the COLORMODEL= option.
specifies whether data
are mapped to the primary X (bottom) axis or to the secondary X2 (top)
axis.
Interaction: The overall plot specification and the layout type determine the
axis display. For more information, see How Axis Features Are Determined.
specifies whether data
are mapped to the primary Y (left) axis or to the secondary Y2 (right)
axis.
Interaction: The overall plot specification and the layout type determine the
axis display. For more information, see How Axis Features Are Determined.
FOOTNOTE 1:
March
1973. “Mesoscale Objective Map Analysis
Using Weighted Time-Series Observations.” Technical Memorandum (NOAA TM ERLNSSL-62), United States National Oceanic and Atmospheric
Administration, Environmental Research Labs, Norman, OK..
[return]