Example Program and Statement Details

Example Graph

The following graph was generated by the Example Program:
Example Dendrogram

Example Program

data clustree;
  input id $ parent $7-12 height nClus;
  label id="Cluster ID" parent="Parent ID";
  datalines;
clus1       3 1
clus2 clus1 0.2 7
clus3 clus1 1.75 2
clus4 clus3 0.7 4
clus5 clus3 0.8 3
clus6 clus4 0.4 5
clus7 clus6 0.1 9
clus8 clus5 0.25 6
clus9 clus8 0.15 8
1     clus9 0 10
2     clus6 0 10
3     clus2 0 10
4     clus7 0 10
5     clus7 0 10
6     clus2 0 10
7     clus4 0 10
8     clus5 0 10
9     clus8 0 10
10    clus9 0 10
run;

proc template;
  define statgraph dendrogram;
  begingraph;
    layout overlay;
      dendrogram nodeID=id parentID=parent clusterheight=height;
    endlayout;
  endgraph;
end;
run;

proc sgrender data=clustree template=dendrogram;
run;

Statement Summary

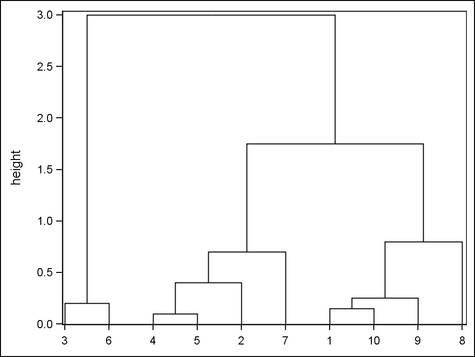
A dendrogram is a tree diagram that is typically used to show the cluster arrangements in hierarchical data. The DENDROGRAM statement supports clusters with only a single root. If multiple roots are found in the data, a warning is issued to the SAS log and the dendrogram is not drawn.
In the Graph Template Language, a DENDROGRAM plot typically appears by itself in a LAYOUT OVERLAY container. You can overlay REFERENCELINE or BANDPLOT statements on a DENDROGRAM, but overlaying other plot types might produce unexpected results.
Using the DENDROGRAM statement in layouts where the axis ranges are merged across cells might produce unexpected results.

Required Arguments

NODEID =column | expression
specifies a column for the ID values of the nodes. Each node ID value must be unique. If duplicate NODEID values are found, the dendrogram is not rendered . The column can be numeric or character, but it must be of the same type and have the same formatted length as the PARENTID column.
The maximum number of nodes that are supported by the dendrogram is determined by the DISCRETEMAX= option in the ODS GRAPHICS statement. The default value is DISCRETEMAX=1000. If the graph data contains more than 1000 discrete values, the dendrogram is not drawn and a warning is issued to the SAS log. In that case, you can use the DISCRETEMAX= option to increase the maximum number of discrete values that are allowed.
PARENTID =column | expression
specifies a column for the parent ID values of the nodes. The column can be numeric or character, but it must be of the same type and have the same formatted length as the NODEID column.
CLUSTERHEIGHT=numeric-column | expression
specifies the column for the height values for each node.

Options

Statement Option
Description
Specifies a column that contains the resultant number of clusters at each node.
Specifies whether the tree is to be cut.
Specifies pruning options for cutting the dendrogram.
Specifies the degree of the transparency of the dendrogram lines.
Specifies a label for a legend.
Specifies the properties of the dendrogram lines.
Assigns a name to a plot statement for reference in other template statements.
Specifies the orientation of the dendrogram leaf axis.
Specifies that the data columns for this plot be used for determining default axis features.
Specifies user-defined roles that can be used to display information in the tooltips.
Specifies the information to display when the cursor is positioned over a dendrogram line.
Specifies display formats for information defined by the tooltip roles.
Specifies display labels for information defined by the tooltip roles.
Specifies the type of tree structure to draw.
Specifies whether data are mapped to the primary X (bottom) axis or the secondary X2 (top) axis.
Specifies whether data are mapped to the primary Y (left) axis or the secondary Y2 (right) axis.
CLUSTERS=numeric-column | expression
specifies a numeric column containing the resultant number of clusters at each node.
Default: no default
Interaction: For this option to take effect, the pruning-options in the CUTOPTS= option must set TYPE=NCLUSTERS and specify a number for the NCLUSTERS= setting.
CUT=boolean
specifies whether the tree is to be cut.
Default: FALSE
Tip: To set the properties of the CUT, use the CUTOPTS= option.
CUTOPTS=(pruning-options)
specifies pruning options for cutting the dendrogram.
The following pruning-options must be specified as a list of option = value pairs separated by blanks. The list must be enclosed in parentheses.
CUTHEIGHT = number
specifies the height at which the tree is to be pruned.
Default: The tree is not pruned.
Interaction: For this setting to take effect, pruning-option TYPE=CUTHEIGHT must also be set. In addition, the CUT= option must be set to TRUE.
NCLUSTERS = number
specifies the number of clusters to use for pruning the tree.
Default: The tree is not pruned.
Interaction: For this setting to take effect, pruning-option TYPE=NCLUSTERS must also be set. In addition, the CLUSTERS= option must be used, and the CUT= option must be set to TRUE.
OUTLINEATTRS=style-element | style-element (line-options) | (line-options)
specifies the attributes of the cut lines. See General Syntax for Attribute Options for the syntax on using a style-element and Line Options for available line-options.
Default: The GraphDataDefault style element.
TYPE = CUTHEIGHT | NCLUSTERS
specifies which rule to use to prune the tree.
Default: CUTHEIGHT
DATATRANSPARENCY=number
specifies the degree of the transparency of the dendrogram lines.
Default: 0
Range: 0 (opaque) to 1 (entirely transparent)
LEGENDLABEL= "string"
specifies a label for the legend item that is associated with this plot.
Default: The name that is assigned to the dendrogram on the NAME= option.
Restriction: This option applies only to an associated DISCRETELEGEND statement.
LINEATTRS=style-element | style-element (line-options) | (line-options)
specifies the attributes of the dendrogram lines. See General Syntax for Attribute Options for the syntax on using a style-element and Line Options for available line-options.
Default: The GraphDataDefault style element.
NAME="string"
Interaction:
assigns a name to a plot statement for reference in other template statements.
Default: no default
Restriction: The string is case sensitive, cannot contain spaces, and must define a unique name within the template.
The specified name is used primarily in legend statements to coordinate the use of colors and line patterns between the graph and the legend.
ORIENT=VERTICAL | HORIZONTAL
specifies the orientation of the dendrogram leaf axis.
Default: VERTICAL
PRIMARY=boolean
specifies that the data columns for this plot be used for determining default axis features.
Default: FALSE
Restriction: This option is ignored if the plot is placed under a GRIDDED or LATTICE layout block.
Details: This option is needed only when two or more plots within an overlay-type layout contribute to a common axis. For more information, see When Plots Share Data and a Common Axis.
ROLENAME=(role-name-list)
specifies user-defined roles that can be used to display information in the tooltips.
Default: no user-defined roles
(role-name-list)
a blank-separated list of rolename = column pairs.
For example, ROLENAME= (TIP1=PCT) assigns the column PCT to the user-defined role TIP1.
Requirement: The role names that you choose must be unique and different from the pre-defined roles NODEID, PARENTID, and CLUSTERHEIGHT.
This option provides a way to add to the data columns that appear in tooltips, which are specified by the TIP= option.
TIP=(role-list)
specifies the information to display when the cursor is positioned over a dendrogram line. If this option is used, it replaces all the information displayed by default. Roles for columns that do not contribute to the dendrogram plot can be specified along with roles that do.
Default: The columns assigned to the following roles are automatically included in the tooltip information: NODEID, PARENTID , and CLUSTERHEIGHT.
(role-list)
an ordered, blank-separated list of unique DENDROGRAM and user-defined roles. DENDROGRAM roles include NODEID , PARENTID , and CLUSTERHEIGHT.
User-defined roles are defined with the ROLENAME= option.
The following example displays tooltips for the columns assigned to the roles NODEID and PARENTID, as well as the column PCT, which is not assigned to any predefined role. The PCT column must first be assigned a role.
  ROLENAME=(TIP1=PCT)
  TIP= (TIP1 NODEID PARENTID)
Requirement: To generate tooltips, you must include an ODS GRAPHICS ON statement that has the IMAGEMAP option specified, and write the graphs to the ODS HTML destination.
Interaction: The labels and formats for the TIP variables can be controlled with the TIPLABEL= and TIPFORMAT= options.
TIPFORMAT=(role-format-list)
specifies display formats for information defined by the tooltip roles.
Default: The column format of the variable assigned to the role.
(role-format-list)
a list of rolename = format pairs separated by blanks.
  ROLENAME=(TIP1=PCT)
  TIP=(TIP1 NODEID PARENTID)
  TIPFORMAT=(TIP1=PERCENT7.2)
Requirement: This option provides a way to control the formats of columns that appear in tooltips. Only the roles that appear in the TIP= option are used. Columns must be assigned to the roles for this option to have any effect. See the ROLENAME= option.
TIPLABEL=(role-label-list)
specifies display labels for information defined by the tooltip roles.
Default: The column label or column name of the variable assigned to the role.
(role-label-list)
a list of rolename = "string" pairs separated by blanks.
   ROLENAME=(TIP1=PCT)
   TIP=(TIP1 NODEID PARENTID)
   TIPLABEL=(TIP1="Percent")
Requirement: This option provides a way to control the labels of columns that appear in tooltips. Only the roles that appear in the TIP= option are used. Columns must be assigned to the roles for this option to have any effect. See the ROLENAME= option.
TREETYPE=RECTANGULAR | TRIANGULAR
specifies the type of tree structure to draw.
Default: RECTANGULAR
XAXIS=X | X2
specifies whether data are mapped to the primary X (bottom) axis or to the secondary X2 (top) axis.
Default: X
Interaction: The overall plot specification and the layout type determine the axis display. For more information, see How Axis Features Are Determined.
YAXIS=Y | Y2
specifies whether data are mapped to the primary Y (left) axis or to the secondary Y2 (right) axis.
Default: Y
Interaction: The overall plot specification and the layout type determine the axis display. For more information, see How Axis Features Are Determined.