Example Program and Statement Details

Example Graph

The following graph was generated by the Example Program:
Example Heat Map Plot

Example Program

proc template;
  define statgraph heatmapparm;
    begingraph;
      layout overlay;
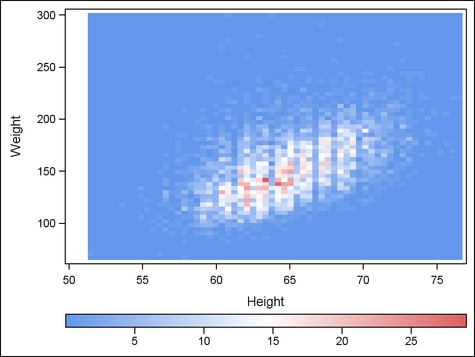
        heatmapparm x=height y=weight colorresponse=count /
          name="heatmapparm" xbinaxis=false ybinaxis=false;
        continuouslegend "heatmapparm" / location=outside valign=bottom;
      endlayout;
    endgraph;
  end;
run;

proc sgrender data=sashelp.gridded template=heatmapparm;
run;

Statement Summary

A heat map is useful for visualizing the magnitude of a response variable in relation to two independent variables. For example, in molecular biology, heat maps can be used to track the expression of genes across multiple sample studies. In the HEATMAPPARM statement, you specify the independent variables in the X and Y arguments. For a response variable that has discrete values, use the COLORGROUP argument, or for a response variable that has interval values, use the COLORRESPONSE argument. For interval response variables, you can use the COLORMODEL= option to define the color ramp that is used to fill the rectangles.

Arguments

X=column | expression
specifies the column for the X values.
Y=column | expression
specifies the column for the Y values.
COLORGROUP =column | discrete-attr-var | expression
specifies a column that is used to discretely color the regions in the heat map. Required when the response variable is of type discrete.
discrete-attr-var
specifies a discrete attribute variable that is defined in a DISCRETEATTRVAR statement.
Restriction: A discrete attribute variable specification must be a direct reference to the attribute variable. It cannot be set by a dynamic variable.
COLORRESPONSE =numeric-column | range-attr-var | expression
specifies a numeric column that is used to color the regions of the heat map. The colors for each region are computed by mapping the values of this column to a color ramp that is defined by the COLORMODEL= option. This argument is required when the response variable is of type interval.
range-attr-var
specifies a range attribute variable that is defined in a RANGEATTRVAR statement.
Restriction: A range attribute variable specification must be a direct reference to the attribute variable. It cannot be set by a dynamic variable.

Options

Statement Option
Description
Specifies a style element to be used with the COLORRESPONSE= argument.
Specifies the degree of the transparency of the filled rectangles.
Specifies whether to display outlined colored rectangles or just colored rectangles.
Specifies the transparency of the area fill in the rectangles.
Assigns a name to a plot statement for reference in other template statements.
Specifies the appearance of the outlines of the filled rectangles.
Specifies that the data columns for this plot and the plot type be used for determining default axis features.
Specifies whether to reverse the gradient that is specified by the COLORMODEL= option.
Specifies user-defined roles that can be used to display information in the tooltips.
Specifies the information to display when the cursor is positioned over a filled rectangle.
Specifies display formats for information defined by the tooltip roles.
Specifies display labels for information defined by the tooltip roles.
Specifies whether data are mapped to the primary X (bottom) axis or the secondary X2 (top) axis.
Specifies whether to use bins as the basis for X-axis tick marks.
Specifies the boundaries of the X-value bins.
Specifies whether the axis ticks and value labels are drawn at the endpoints of the bins or midpoints of the bins.
Specifies the amount of horizontal space on either side of each filled rectangle.
Specifies whether the X values represent lower endpoints, midpoints, or upper endpoints of the bins.
Specifies whether data are mapped to the primary Y (left) axis or the secondary Y2 (right) axis.
Specifies whether to use bins as the basis for Y-axis tick marks.
Specifies the boundaries of the Y-value bins.
Specifies whether the axis ticks and value labels are drawn at the endpoints of the bins or midpoints of the bins.
Specifies the amount of vertical space on either side of each filled rectangle.
Specifies whether the Y values represent lower endpoints, midpoints, or upper endpoints of the bins.
COLORMODEL=style-element
specifies a style element to be used with the COLORRESPONSE= argument.
Default: The ThreeColorRamp style element. The STARTCOLOR attribute represents low response values and the ENDCOLOR attribute represents high response values.
style-element
Name of a style element. The style element can contain these style attributes:
STARTCOLOR Specifies a color for the smallest data value of the COLORRESPONSE variable.
NEUTRALCOLOR Specifies a color for the midpoint of the range of the COLORRESPONSE variable.
ENDCOLOR Specifies a color for the highest data value of the COLORRESPONSE variable.
Interaction: The NEUTRALCOLOR attribute is not used for two-color ramps.
DATATRANSPARENCY=number
specifies the degree of the transparency of the filled rectangles.
Default: 0
Range: 0 (opaque) to 1 (entirely transparent)
DISPLAY=STANDARD | ALL | (display-options)
specifies whether to display outlined, colored rectangles or just colored rectangles.
Default: STANDARD
STANDARD
displays colored rectangles
ALL
displays outlined, colored rectangles
(display-options)
a list of display-options, enclosed in parentheses. Currently, only the following display-option is supported:
OUTLINE displays outlines around the filled rectangles (same as keyword ALL)
FILLATTRS=(TRANSPARENCY=number)
specifies the transparency of the area fill in the rectangles.
Default: The DATATRANSPARENCY= option value
Range: 0 (opaque) to 1 (entirely transparent)
Restriction: Only the TRANSPARENCY= sub option is honored. If a style element or any other fill suboption is specified, it is ignored by the HEATMAPPARM statement.
Note: The fill colors are determined by the COLORRESPONSE= or COLORGROUP= column.
NAME="string"
assigns a name to a plot statement for reference in other template statements.
Default: no default
Restriction: The string is case sensitive, cannot contain spaces, and must define a unique name within the template.
Tip: The specified name is used primarily in legend statements to indicate the colors associated with the response values.
OUTLINEATTRS=style-element | (line-options)
specifies the appearance of the outlines of the filled rectangles. See General Syntax for Attribute Options for the syntax on using a style-element and Line Options for available line-options.
Default: The ContrastColor and LineThickness attributes of the GraphOutlines style element.
Interaction: For this option to have any effect, outlines must be enabled by the ODS style or the DISPLAY= option.
PRIMARY=boolean
specifies that the data columns for this plot and the plot type be used for determining default axis features.
Default: FALSE
Restriction: This option is ignored if the plot is placed under a GRIDDED or LATTICE layout block.
Details: This option is needed only when two or more plots within an overlay-type layout contribute to a common axis. For more information, see When Plots Share Data and a Common Axis.
REVERSECOLORMODEL=boolean
specifies whether to reverse the gradient that is specified by the COLORMODEL= option.
Default: FALSE
ROLENAME= (role-name-list)
specifies user-defined roles that can be used to display information in the tooltips. Columns for the tooltip display are specified in the TIP= option.
Default: no user-defined roles
(rolename-list)
a blank-separated list of rolename = column pairs.
For example, ROLENAME=(TIP1=PCT) assigns the data column PCT to the user-defined role TIP1.
Requirement: The role names that you choose must be unique and different from the pre-defined roles X, Y, COLORGROUP, and COLORRESPONSE.
Interaction: For this option to take effect, the TIP= option must be used to add the roles in the role list to the tooltips.
TIP=(role-list)
specifies the information to display when the cursor is positioned over a filled rectangle. If this option is used, it replaces all the information displayed by default. Roles for columns that do not contribute to the heat map can be specified along with roles that do.
Default: The columns assigned to these roles are automatically included in the tooltip information: X and Y, and COLORGROUP or COLORRESPONSE.
(role-list)
an ordered, blank-separated list of unique HEATMAPPARM and user-defined roles. HEATMAPPARM roles include X and Y.
The following example displays tooltips for the columns X and PCT. The PCT column is not assigned to any pre-defined HEATMAPPARM role, so it must first be assigned a role:
ROLENAME=(TIP1=PCT)
TIP=(X TIP1)
Requirement: To generate tooltips, you must include an ODS GRAPHICS ON statement that has the IMAGEMAP option specified, and write the graphs to the ODS HTML destination.
Interaction: The labels and formats for the TIP variables can be controlled with the TIPLABEL= and TIPFORMAT= options.
TIPFORMAT=(role-format-list)
specifies display formats for information defined by the tooltip roles.
Default: The column format of the variable assigned to the role or BEST6. if no format is assigned to a numeric column.
(role-format-list)
a list of role-name = format pairs separated by blanks.
ROLENAME=(TIP1=PCT)
TIP=(TIP1 X)
TIPFORMAT=(TIP1=PERCENT7.2)
Requirement: Only the roles that appear in the TIP= option are used.
Requirement: Columns must be assigned to the roles for this option to have any effect. See ROLENAME=.
Tip: This option provides a way to control the formats of columns that appear in tooltips.
TIPLABEL=(role-label-list)
specifies display labels for information defined by the tooltip roles.
Default: The column label or column name of the variable assigned to the role.
(role-label-list)
a list of role-name = "string" pairs separated by blanks.
ROLENAME=(TIP1=PCT)
TIP=(TIP1 X)
TIPLABEL=(TIP1="Percent")
Requirement: Only the roles that appear in the TIP= option are used.
Requirement: Columns must be assigned to the roles for this option to have any effect. See ROLENAME=.
Tip: This option provides a way to control the formats of columns that appear in tooltips.
XAXIS=X | X2
specifies whether data are mapped to the primary X (bottom) axis or to the secondary X2 (top) axis.
Default: X
Interaction: The overall plot specification and the layout type determine the axis display. For more information, see How Axis Features Are Determined.
XBINAXIS= boolean
specifies whether to use bins as the basis for X-axis tick marks. If this option is set to FALSE, a standard axis is used, ignoring bin boundaries and midpoints.
Default: TRUE
Interaction: If this option is set to TRUE, then the XENDLABELS= option determines how the axis ticks and value labels are displayed. If this option is set to FALSE, the XENDLABELS= option is ignored.
Interaction: When this option is set tot TRUE, the axis ticks are in predetermined locations and are not changed if the parent layout specifies axis suboptions like TICKVALUELIST= and TICKVALUESEQUENCE=.
XBOUNDARIES= (numeric-list)
specifies the boundaries of the X-value bins.
Default: no default
Requirement: The numeric-list must be enclosed in parentheses and each item separated by a blank.
Interaction: This option is ignored if the X values are not numeric.
Tip: This option can be used to specify unequal bins.
Discussion: The keywords MIN and MAX can be used as one of the values in the list of boundaries. Keywords MIN and MAX indicate the minimum and maximum data values for the X variable. Example:
xboundaries=(MIN 20 200 250 MAX)
XENDLABELS= boolean
specifies whether the axis ticks and value labels are drawn at the endpoints of the bins or midpoints of the bins.
Default: FALSE. The axis ticks and values labels are drawn at the bin midpoints.
Interaction: If this option is set to FALSE, then the axis ticks and value labels are drawn at the bin midpoints, regardless of whether the XVALUES= option identifies the X data as endpoint values or midpoint values.
Interaction: This option is ignored in any of the following conditions:
  • if the X values are not numeric
  • If XBINAXIS=FALSE
XGAP= number
specifies the amount of horizontal space on either side of each filled rectangle.
Default: 0
XVALUES=MIDPOINTS | LEFTPOINTS | RIGHTPOINTS
specifies whether the X values represent lower endpoints, midpoints, or upper endpoints of the bins.
Default: MIDPOINTS
See Also: The XENDLABELS= option.
YAXIS=Y | Y2
specifies whether data are mapped to the primary Y (left) axis or to the secondary Y2 (right) axis.
Default: Y
Interaction: The overall plot specification and the layout type determine the axis display. For more information, see How Axis Features Are Determined.
YBINAXIS= boolean
specifies whether to use bins as the basis for Y-axis tick marks. If this option is set to FALSE, a standard axis is used, ignoring bin boundaries and midpoints.
Default: TRUE
Interaction: If this option is set to TRUE, then the YENDLABELS= option determines how the axis ticks and value labels are displayed. If this option is set to FALSE, the YENDLABELS= option is ignored.
Interaction: When this option is set to TRUE, the axis ticks are in predetermined locations and are not changed if the parent layout specifies axis suboptions like TICKVALUELIST= and TICKVALUESEQUENCE=.
YBOUNDARIES= (numeric-list)
specifies the boundaries of the Y-value bins.
Default: no default
Requirement: The numeric-list must be enclosed in parentheses and each item separated by a blank.
Interaction: This option is ignored if the Y values are not numeric.
Tip: This option can be used to specify unequal bins.
Discussion: The keywords MIN and MAX can be used as one of the values in the list of boundaries. Keywords MIN and MAX indicate the minimum and maximum data values for the Y variable. Example:
yboundaries=(MIN 20 200 250 MAX)
YENDLABELS= boolean
specifies whether the axis ticks and value labels are drawn at the endpoints of the bins or midpoints of the bins.
Default: FALSE. The axis ticks and values labels are drawn at the bin midpoints.
Interaction: If this option is set to FALSE, then the axis ticks and value labels are drawn at the bin midpoints, regardless of whether the YVALUES= option identifies the Y data as endpoint values or midpoint values.
Interaction: This option is ignored in any of the following conditions:
  • if the Y values are not numeric
  • If YBINAXIS=FALSE
YGAP= number
specifies the amount of vertical space on either side of each filled rectangle.
Default: 0
YVALUES=MIDPOINTS | LEFTPOINTS | RIGHTPOINTS
specifies whether the Y values represent lower endpoints, midpoints, or upper endpoints of the bins.
Default: MIDPOINTS
See Also: The YENDLABELS= option.