Example Program and Statement Details

Example Graph

The following graph was generated by the Example Program:
Example Graph with a Reference Line

Example Program

proc template;
  define statgraph referenceline;
    begingraph;
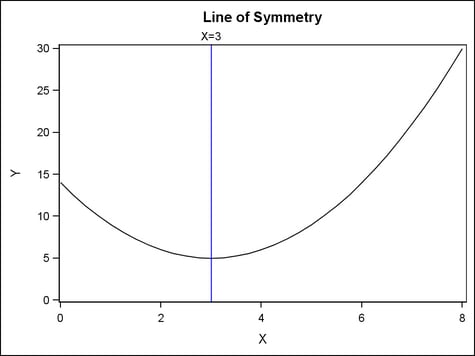
      entrytitle "Line of Symmetry";
      layout overlay / yaxisopts=(linearopts=(viewmin=0));
        seriesplot x=x y=y;
        referenceline x=3 /
          lineattrs=(color=blue) curvelabel="X=3";
      endlayout;
   endgraph;
  end;
run;

data test;
  do X=0 to 8 by .25;
    Y=(x-3)*(x-3) + 5;
	output;
  end;
run;

proc sgrender data=test template=referenceline;
run;

Statement Summary

Reference lines are always drawn perpendicular to the axes. They are drawn from one axis boundary to the companion boundary (X to X2 or Y to Y2). Axis offsets do not apply to reference lines.
A REFERENCELINE statement can be used only within 2-D overlay-type layouts (OVERLAY, OVERLAYEQUATED, or PROTOTYPE). A stand-alone plot statement that provides a sufficient data range for determining axis extents must be included in the layout. For example, a REFERENCELINE statement can be used with a scatter plot or a histogram.
If a column is used to generate multiple reference lines, the column type (numeric or string) must agree with the type of data presented on the axis.

Arguments

Either the X= or the Y= argument must be used in the REFERENCELINE statement.
X=x-axis-value | column | expression
specifies the X intercept of the reference line or lines.
Requirement: If X is not specified, then Y must be specified.
By default, if the value specified for the X= argument is outside of the data range, then the data range is extended to include the specified intercept. This behavior can be changed with the CLIP= option.
Values must be the same type as the data type of the X axis. For example, you should use numeric SAS date or time values (or SAS date/time constants) for a time axis.
Unformatted numeric values do not map to a formatted discrete axis. When the X axis is a discrete axis, the X axis value must be the formatted value that appears on the X axis. If a column is specified for the values in that case, the specified column must have the same format that is used for the X axis.
Y=y-axis-value | column | expression
specifies the Y intercept of the reference line or lines.
Requirement: If Y is not specified, then X must be specified.
By default, if the value specified for the Y= argument is outside of the data range, then the data range is extended to include the specified intercept. This behavior can be changed with the CLIP= option.
Values must be the same type as the data type of the X axis. For example, you should use numeric SAS date or time values (or SAS date/time constants) for a time axis.
Unformatted numeric values do not map to a formatted discrete axis. When the Y axis is a discrete axis, the Y axis value must be the formatted value that appears on the Y axis. If a column is specified for the values in that case, the specified column must have the same format that is used for the Y axis.

Options

Statement Option
Description
Specifies whether the data for the reference line or lines are considered when determining the data ranges for the axes.
Specifies a label for the reference line or lines.
Specifies the color and font attributes of the reference line label(s).
Specifies the location of the reference line label relative to the plot area.
Specifies the position of the reference line label relative to the reference line.
Specifies the degree of the transparency of the reference line or lines.
Specifies an amount to offset all reference lines from discrete X or Y values.
Specifies a label for a legend.
Specifies the properties of the reference line or lines.
Assigns a name to a plot statement for reference in other template statements.
Specifies whether data are mapped to the primary X (bottom) axis or the secondary X2 (top) axis.
Specifies whether data are mapped to the primary Y (left) axis or the secondary Y2 (right) axis.
CLIP=boolean
specifies whether the data for the line are considered when determining the data ranges for the axes.
Default: FALSE
FALSE
The data for the line contributes to data range for each axis. Each axis might be extended to force the display of the line.
TRUE
The data for the line are ignored when establishing axis scales. Each axis scale is determined by the other plots in the layout. This might result in the line not being displayed if its data range is not within the data ranges of the other plots.
CURVELABEL="string" | column | expression
specifies a label for the reference line or lines.
Default: no curve label is displayed
Interaction:
  • If the X or Y argument specifies a value, use "string".
  • If the X or Y argument specifies a column, use column to define the label for each value.
The font and color attributes for the label are specified by the CURVELABELATTRS= option.
CURVELABELATTRS=style-element | style-element (text-options) | (text-options)
specifies the color and font attributes of the reference line label(s). See General Syntax for Attribute Options for the syntax on using a style-element and Text Options for available text-options.
Default: The GraphValueText style element.
Interaction: For this option to take effect, the CURVELABEL= option must also be used.
CURVELABELLOCATION=INSIDE | OUTSIDE
specifies the location of the reference line label relative to the plot area.
Default: OUTSIDE
INSIDE
inside the plot area
OUTSIDE
outside the plot area
Restriction: OUTSIDE cannot be used when the REFERENCELINE is used in multicell layouts such as LATTICE, DATAPANEL, or DATALATTICE, where axes might be external to the grid.
Interaction: For this option to take effect, the CURVELABEL= option must also be specified.
Interaction: This option is used in conjunction with the CURVELABELPOSITION= option to determine where the line labels appear. For more information, see Location and Position of Curve Labels.
CURVELABELPOSITION=AUTO | MAX | MIN
specifies the position of the reference line label relative to the reference line.
Default: AUTO when CUVELABELLOCATION=OUTSIDE. MAX when CURVELABELLOCATION=INSIDE
AUTO
Only used when CURVELABELLOCATION=OUTSIDE. The line label is positioned automatically near the line boundary along unused axes whenever possible (typically Y2 and X2) to avoid collision with tick values.
MAX
Forces the line label to appear near maximum line values (typically, the top or right).
MIN
Forces the line label to appear near minimum line values (typically, the bottom or left).
Restriction: The AUTO setting is ignored if CURVELABELLOCATION=INSIDE is specified.
Interaction: For this option to take effect, the CURVELABEL= option must also be specified.
Interaction: This option is used in conjunction with the CURVELABELLOCATION= option to determine where the line label appears. For more information, see Location and Position of Curve Labels.
DATATRANSPARENCY=number
specifies the degree of the transparency of the reference line.
Default: 0
Range: 0 (opaque) to 1 (entirely transparent)
DISCRETEOFFSET= number
specifies an amount to offset all reference lines from discrete X or Y values.
Default: 0 (no offset, all reference lines are centered on discrete X or Y values)
Range: -0.5 to +0.5 where .5 represents half the distance between discrete ticks. A positive offset is to the right for a vertical reference line and up for a horizontal reference line. If the layout's axis options set REVERSE=TRUE, then the offset direction is also reversed.
LEGENDLABEL= "string"
specifies a label for the legend item that is associated with this plot.
Default: The string specified on the NAME= option.
Restriction: This option applies only to an associated DISCRETELEGEND statement.
LINEATTRS=style-element | style-element (line-options) | (line-options)
specifies the attributes of the reference line. See General Syntax for Attribute Options for the syntax on using a style-element and Line Options for available line-options.
Default: The GraphReference style element.
NAME="string"
assigns a name to a plot statement for reference in other template statements.
Default: no default
Restriction: The string is case sensitive, cannot contain spaces, and must define a unique name within the template.
Interaction: The string is used as the default legend label if the LEGENDLABEL= option is not used.
The specified name is used primarily in legend statements to coordinate the use of colors and line patterns between the graph and the legend.
XAXIS=X | X2
specifies whether data are mapped to the primary X (bottom) axis or to the secondary X2 (top) axis.
Default: X
Restriction: Another plot that establishes a data range for the axis must be included.
Interaction: This option is ignored if the X= argument is not specified.
Interaction: The overall plot specification and the layout type determine the axis display. For more information, see How Axis Features Are Determined.
YAXIS=Y | Y2
specifies whether data are mapped to the primary Y (left) axis or to the secondary Y2 (right) axis.
Default: Y
Restriction: Another plot that establishes a data range for the axis must be included.
Interaction: This option is ignored if the Y= argument is not specified.
Interaction: The overall plot specification and the layout type determine the axis display. For more information, see How Axis Features Are Determined.