Flexible Templates
Several features in the GTL can make template definitions
less restrictive on input data and more general in nature. These features
enable a single compiled template to produce many output variations.
Expressions and Functions
In the GTL, expressions
can be used to compute constants and data columns. The expressions
must be enclosed in an EVAL construct. Within the expression, you
can use DATA step functions, arithmetic operators, and other special
functions supported by the GTL.
Expressions are also
useful in text statements like ENTRY and ENTRYTITLE. Both of these
statements support rich text and have special text commands such as
{SUP}, {SUB}, and {UNICODE}, which enable subscripting, superscripting,
and Unicode characters.
The following template
shows how the  symbol is included in the title line using its hexadecimal
Unicode value. Also, new data columns are computed for the upper and
lower error bars of the scatter plot, based on the input columns MEANWEIGHT
and STDERR.
symbol is included in the title line using its hexadecimal
Unicode value. Also, new data columns are computed for the upper and
lower error bars of the scatter plot, based on the input columns MEANWEIGHT
and STDERR.
symbol is included in the title line using its hexadecimal
Unicode value. Also, new data columns are computed for the upper and
lower error bars of the scatter plot, based on the input columns MEANWEIGHT
and STDERR.
proc template;
 define statgraph expression;
  begingraph;
  entrytitle "Errorbars show " {unicode "00B1"x} "2 SE";
   layout overlay;
    scatterplot x=age y=meanweight /
       yerrorlower=eval(meanweight - 2*stderr)
       yerrorupper=eval(meanweight + 2*stderr);
    seriesplot x=age y=meanweight;
   endlayout;
  endgraph;
 end;
run;
For more information
about using expressions, see Expressions. For more information about using
functions, see Functions.
Dynamics and Macro Variables
An extremely useful
technique for generalizing templates is to define dynamics, macro
variables, or both. The dynamics and macro variables resolve when
the template is executed. The following PROC TEMPLATE statements can
be used in a DEFINE STATGRAPH block:
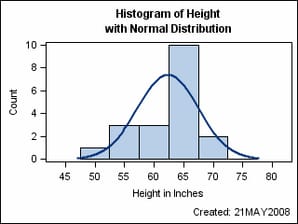
The following example
defines a template named DYNAMICS that can create a histogram and
density plot for any variable. It defines both macro variables and
dynamics for run-time substitution. No data-dependent information
is hard coded in the template.
Note: You can initialize macro
variables with %LET statements and dynamics with SGRENDER’s
DYNAMIC statement.
proc template;
 define statgraph dynamics;
   mvar SYSDATE9 SCALE;
   nmvar BINS;
   dynamic VAR VARLABEL;
   begingraph;
     entrytitle "Histogram of " VAR;
     entrytitle "with Normal Distribution";
     layout overlay / xaxisopts=(label=VARLABEL);
       histogram VAR /  scale=SCALE  nbins=BINS;
       densityplot VAR / normal();
     endlayout;
     entryfootnote halign=right "Created: " SYSDATE9 /
       textattrs=GraphValueText;
   endgraph;
 end;
run;

%let bins=6;
%let scale=count;
proc sgrender data=sashelp.class
              template=dynamics;
  dynamic var="Height" varlabel="Height in Inches";
run;
For more information
about using dynamics and macro variables, see Dynamics and Macro Variables.
Conditional Logic
Using conditional logic,
you can create templates that have multiple visual results or output
representations, depending on existing conditions. The evaluation
of a logical expression must generate one or more complete statements
(not portions of statements). All conditional logic uses one of the
following constructs:
In the IF statement, condition must be enclosed in parentheses. The condition can be any standard SAS expression
involving arithmetic, logical operators, comparison operators, Boolean
operators, or concatenation operators. The expression can also use
SAS DATA step functions. The expression resolves to a single numeric
value, which is true or false.
In the following example,
a histogram is conditionally overlaid with a normal distribution curve,
a Kernel Density Estimate distribution curve, both, or neither:
proc template;
  define statgraph conditional;
   dynamic VAR VARLABEL BINS CURVE;
   begingraph;
    entrytitle "Histogram of " VAR;
    layout overlay / xaxisopts=(label=VARLABEL);
     histogram VAR /  nbins=BINS;

     if (upcase(CURVE) in ("ALL"  "KERNEL"))
        densityplot VAR / kernel() name="k"
                          legendlabel="Kernel"
                          lineattrs=(pattern=dash);
     endif;

     if (upcase(CURVE) in ("ALL" "NORMAL"))
        densityplot VAR / normal() name="n"
                          legendlabel="Normal";
     endif;

     discretelegend "n" "k";
   endlayout;
  endgraph;
 end;
run;
Note that the legend
syntax does not have to be made conditional. At run time, each plot
name in the legend is checked. If the plot does not exist, its name
is removed from the legend name list. If no names appear in the DISCRETELEGEND
statement, the legend “drops out” and the histogram
size is adjusted to fill the remaining space.
For more information
about using conditional logic, see Conditional Logic.