Legends
Many plot statements
support a GROUP= option that partitions the data into unique values,
performs separate analysis, if necessary, and automatically assigns
distinct visual properties to each group value. The visual properties
of group values are defined by the style in effect.
Legends are not automatically
displayed for plots with group values. Rather, an appropriate legend
statement must be added to the template to generate the desired legend.
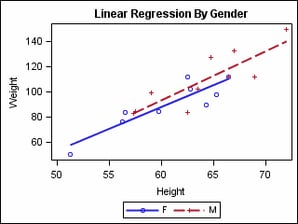
In the following example, a legend is added to display markers and
line patterns that show the association between the group values from
a scatter plot and corresponding linear regression lines. The example
shows the mechanism that GTL uses to associate a legend with its corresponding
plot(s): a name is assigned to each plot that must be represented
in the legend, and these names are then used as arguments for the
legend statement (in this case, MERGEDLEGEND).