Example Program and Statement Details
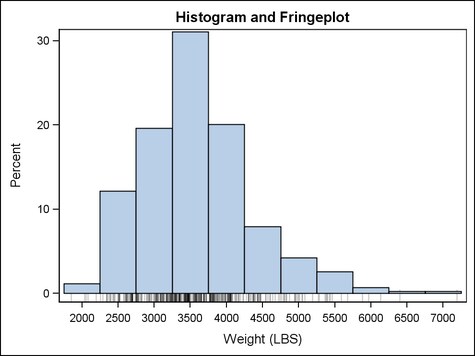
Example Program
proc template;
  define statgraph fringeplot;
    dynamic VAR VARLABEL;
    begingraph;
      entrytitle "Histogram and Fringeplot";
      layout overlay / xaxisopts=(label=VARLABEL)
                       yaxisopts=(offsetmin=.03);
        fringeplot VAR / datatransparency=.75
          fringeheight=3pct;
        histogram VAR;
      endlayout;
    endgraph;
  end;
run;

proc sgrender data=sashelp.cars template=fringeplot;
  dynamic var="weight" varlabel="Weight (LBS)";
run;
Options
specifies the attributes
of the fringe lines for the data points. See General Syntax for Attribute Options for the syntax
on using a style-element and Line Options for available line-options.
specifies user-defined
roles that can be used to display information in the tooltips.
Requirement: The
role names that you choose must be unique and different from the pre-defined
role X.
This option provides
a way to add to the data columns that appear in tooltips specified
by the TIP= option.
specifies the information
to display when the cursor is positioned over a fringe line. If this
option is used, it replaces all the information displayed by default.
Roles for columns that do not contribute to the fringe plot can be
specified along with roles that do.
Default: The
columns assigned to these roles are automatically included in the
tooltip information: X.
an ordered, blank-separated
list of unique FRINGEPLOT and user-defined roles. The FRINGEPLOT role
is X.
Requirement: To
generate tooltips, you must include an ODS GRAPHICS ON statement that
has the IMAGEMAP option specified, and write the graphs to the ODS
HTML destination.
Interaction: The
labels and formats for the TIP variables can be controlled with the TIPLABEL= and TIPFORMAT= options.
specifies display formats
for tip columns.
Default: The
column format of the variable assigned to the role or BEST6. if no
format is assigned to a numeric column.
Requirement: This
option provides a way to control the formats of columns that appear
in tooltips. Only the roles that appear in the TIP= option are used.
Columns must be assigned to the roles for this option to have any
effect. See the ROLENAME= option.
specifies display labels
for tip columns.
Requirement: This
option provides a way to control the labels of columns that appear
in tooltips. Only the roles that appear in the TIP= option are used.
Columns must be assigned to the roles for this option to have any
effect. See the ROLENAME= option.
specifies whether data
are mapped to the primary X (bottom) axis or to the secondary X2 (top)
axis.
Interaction: The
overall plot specification and the layout type determine the axis
display. For more information, see How Axis Features Are Determined.