Example Program and Statement Details
Example Program
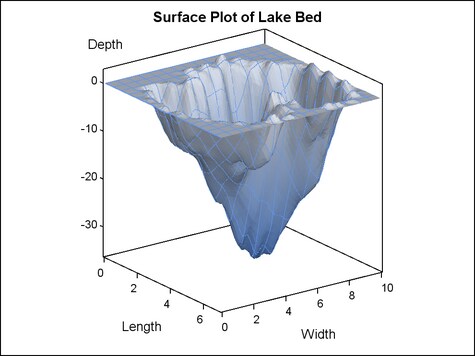
proc template;
  define statgraph surfaceplotparm;
    begingraph;
      entrytitle "Surface Plot of Lake Bed";
      layout overlay3d / cube=false;
        surfaceplotparm x=length y=width z=depth /
          reversecolormodel=true
          surfacecolorgradient=depth
          colormodel=twocoloraltramp;
      endlayout;
    endgraph;
  end;

/* create gridded data for surface
 * proc g3grid is a sas/graph procedure */
proc g3grid data=sashelp.lake out=gridded;
  grid width*length = depth / naxis1=75 naxis2=75;
run;

proc sgrender data= gridded template=surfaceplotparm;
run;
Statement Summary
The SURFACEPLOTPARM
statement assumes that the Z response values have been provided for
a uniform X-Y grid. Missing Z values leave a “hole”
in the surface. The observations in the input data set should form
an evenly spaced grid of horizontal (X and Y) values and one vertical
(Z) value for each of these combinations. The observations should
be in sorted order of Y and X to obtain an accurate graph.
The G3GRID procedure
(requires a SAS/GRAPH license) can be used to interpolate the necessary
values to produce a data set with nonmissing Z values for every combination
of X and Y. The G3GRID procedure can also smooth data with spline
interpolations. For further details, see the documentation for PROC
G3GRID in the SAS/GRAPH: Reference.
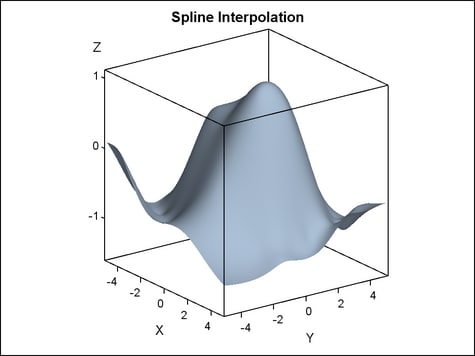
data nums;
  do i=1 to 30;
     X=10*ranuni(33)-5;
     Y=10*ranuni(35)-5;
     Z=sin(sqrt(x*x+y*y));
     output;
  end;
run;
proc g3grid data=nums out=gridded;
  grid y*x=z / spline
               axis1=-5 to 5 by .1
               axis2=-5 to 5 by .1;
run;
proc sort data=gridded; by y x; run;

proc template;
  define statgraph g3grid_surface;
   begingraph;
    entrytitle "Spline Interpolation";
    layout overlay3d;
      surfaceplotparm x=x y=y z=z /
        surfacetype=fill;
    endlayout;
   endgraph;
  end;
run;

proc sgrender data=gridded template=g3grid_surface;
run;
The KDE procedure can
produce an output data set of gridded X-Y values where the Z value
is computed to be a Kernel Density Estimate of the distribution of
X and Y. For further details, see the documentation for PROC KDE in
the SAS/STAT user’s guide.
Using PROC KDE on the nums data generated in the previous example,
the following code computes a Kernel Density Estimate and generates
this figure:
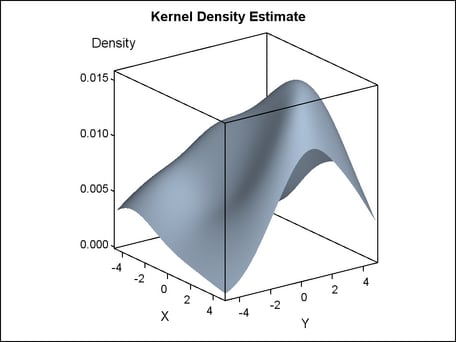
/* use the nums data generated in the previous example */
proc kde data=nums;
  bivar x y / ngrid=100
    out=binned(rename=(value1=X value2=Y));
run;
proc sort data=binned; by y x;
  label x="X" y="Y";
run;

proc template;
  define statgraph kde_surface;
   begingraph;
     entrytitle "Kernel Density Estimate";
     layout overlay3d;
       surfaceplotparm x=x y=y z=density /
         surfacetype=fill;
     endlayout;
   endgraph;
  end;
run;

proc sgrender data=binned template=kde_surface;
run;
Options
specifies a style element
that is used to determine gradient surface colors.
Name of a style element.
The style element should contain these style attributes:
| STARTCOLOR | specifies a color for the smallest data value of the SURFACECOLORGRADIENT variable |
| NEUTRALCOLOR | specifies a color for the midpoint of the range Of the SURFACECOLORGRADIENT variable |
| ENDCOLOR | specifies a color for the highest data value of the SURFACECOLORGRADIENT variable |
Interaction: For this option to have any effect, the SURFACECOLORGRADIENT= option must also be used.
The REVERSECOLORMODEL= option can be used to reverse the
start and end colors of the ramp assigned to the color model.
specifies the color
of the filled surface or the wire-frame mesh. See General Syntax for Attribute Options for the syntax
on using a style-element and Fill Options for available fill-options.
specifies that the
data columns for this plot and the plot type be used for determining
default axis features.
Details: This option is needed only when two or more plots within an OVERLAY3D
layout contribute to a common axis. For more information, see When Plots Share Data and a Common Axis.
specifies whether to
reverse a gradient (color ramp) defined by the COLORMODEL= option.