Example Program and Statement Details
Example Program
proc template;
define statgraph histogramparm;
begingraph;
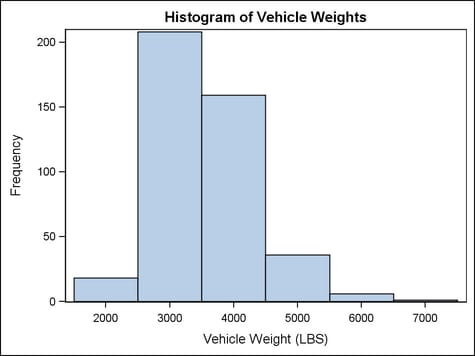
entrytitle "Histogram of Vehicle Weights";
layout overlay;
histogramparm x=midpoint y=frequency;
endlayout;
endgraph;
end;
run;
data bins;
input Midpoint Frequency;
label midpoint="Vehicle Weight (LBS)";
datalines;
2000 18
3000 208
4000 159
5000 36
6000 6
7000 1
;
run;
proc sgrender data=bins template=histogramparm;
run;
Options
Specifies whether to
use bins as the basis for axis tick marks.
Interaction: When
this option is set to TRUE, some X-axis options that are set on the
parent layout might not apply, such as TICKVALUELIST= and TICKVALUESEQUENCE=.
Interaction: This
option is ignored if this HISTOGRAMPARM is not the primary plot (for
more information about primary plots, see When Plots Share Data and a Common Axis).
specifies a column
for the bar labels. The labels appear at the top or end of each bar,
depending on the chart orientation.
Note: This feature is
for the second maintenance release of SAS 9.3 and later. See What's New in the SAS 9.3 Graph Template Language.
specifies the color
and font attributes of the bar labels. See General Syntax for Attribute Options for the syntax
on using a style-element and Text Options for available text-options.
Note: This feature is
for the second maintenance release of SAS 9.3 and later. See What's New in the SAS 9.3 Graph Template Language.
specifies the degree
of the transparency of the bars (outline and fill).
Tip: The FILLATTRS= option can be used to set transparency
for just the bar fills. You can combine this option with FILLATTRS=
to set one transparency for the bar outlines but a different transparency
for the bar fills. Example:
datatransparency=0.2 fillattrs=(transparency=0.6)
specifies whether to
display outlined bars, filled bars, or outlined and filled bars.
a list of comma-separated
options enclosed in parentheses. Any of the options from the OUTLINEATTRS= and FILLATTRS= options can be used. The specified
list must include one of the following:
specifies whether axis
ticks and value labels are drawn at the endpoints of the bins or midpoints
of the bins.
| TRUE | draws the axis ticks and value labels at the bin endpoints |
| FALSE | draws the axis ticks and value labels at the bin midpoints |
Interaction: If BINAXIS= FALSE or this HISTOGRAMPARM is not the primary plot, then
this option is ignored.
specifies the appearance
of the interior fill area of the bars. See General Syntax for Attribute Options for the syntax
on using a style-element and Fill Options for available fill-options.
Interaction: For
this option to have any effect, the fill must be enabled by the ODS
style or the DISPLAY= option.
Tip: The DATATRANSPARENCY= option sets the transparency for
bar fills and bar outlines. You can combine this option with DATATRANSPARENCY=
to set one transparency for the outlines but a different transparency
for the fills. Example:
datatransparency=0.2 fillattrs=(transparency=0.6)
specifies the line
properties of the bar outlines. See General Syntax for Attribute Options for the syntax
on using a style-element and Line Options for available line-options.
Interaction: For
this option to have any effect, the outlines must be enabled by the
ODS style or the DISPLAY= option.
specifies that the
data columns for this plot be used for determining default axis features.
Details: This
option is needed only when two or more plots within an overlay-type
layout contribute to a common axis. For more information, see When Plots Share Data and a Common Axis.
specifies user-defined
roles that can be used to display information in the tooltips.
Requirement: The
role names that you choose must be unique and different from the pre-defined
roles X, Y, and DATALABEL.
This option provides
a way to add to the data columns that appear in tooltips specified
by the TIP= option.
specifies the information
to display when the cursor is positioned over a histogram bin. If
this option is used, it replaces all the information displayed by
default. Roles for columns that do not contribute to the histogram
can be specified along with roles that do.
Default: The
columns assigned to these roles are automatically included in the
tooltip information: X and Y.
an ordered, blank-separated
list of unique HISTOGRAMPARM and user-defined roles. HISTOGRAMPARM
roles include X, Y, and DATALABEL.
User-defined roles
are defined with the ROLENAME= option.
Requirement: To
generate tooltips, you must include an ODS GRAPHICS ON statement that
has the IMAGEMAP option specified, and write the graphs to the ODS
HTML destination.
Interaction: The
labels and formats for the TIP variables can be controlled with the TIPLABEL= and TIPFORMAT= options.
specifies display formats
for tip columns.
Default: The
column format of the variable assigned to the role or BEST6. if no
format is assigned to a numeric column.
Requirement: This
option provides a way to control the formats of columns that appear
in tooltips. Only the roles that appear in the TIP= option are used.
Columns must be assigned to the roles for this option to have any
effect. See the ROLENAME= option.
specifies display labels
for tip columns.
Requirement: This
option provides a way to control the labels of columns that appear
in tooltips. Only the roles that appear in the TIP= option are used.
Columns must be assigned to the roles for this option to have any
effect. See the ROLENAME= option.
specifies whether data
are mapped to the primary X (bottom) axis or to the secondary X2 (top)
axis.
Interaction: The
overall plot specification and the layout type determine the axis
display. For more information, see How Axis Features Are Determined.
specifies whether data
are mapped to the primary Y (left) axis or to the secondary Y2 (right)
axis.
Interaction: The
overall plot specification and the layout type determine the axis
display. For more information, see How Axis Features Are Determined.