Example Program and Statement Details
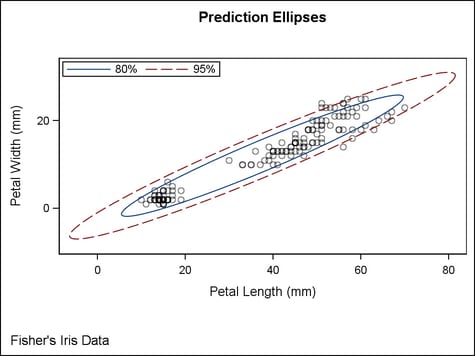
Example Program
proc template;
  define statgraph ellipse;
    begingraph;
      entrytitle "Prediction Ellipses";
      layout overlayequated / equatetype=equate;
        scatterplot x=petallength y=petalwidth /
          datatransparency=.5;
        ellipse x=petallength y=petalwidth /
          type=predicted  alpha=.2
          name="p80" legendlabel="80%"
          outlineattrs=graphconfidence;
        ellipse x=petallength y=petalwidth /
          type=predicted  alpha=.05
          name="p95" legendlabel="95%"
          outlineattrs=graphconfidence2;
        discretelegend "p80" "p95" /
          location=inside autoalign=(topleft);
      endlayout;
      entryfootnote halign=left "Fisher's Iris Data";
    endgraph;
  end;
run;
proc sgrender data=sashelp.iris template=ellipse;
run;
Confidence and Prediction Ellipses
Two types of ellipses
can be computed for the input data (where observations correspond
to points in a scatter plot). One is a confidence ellipse for the
population mean (TYPE=MEAN), and the other is a prediction ellipse
for a new observation (TYPE=PREDICT). Both assume a bivariate normal
distribution.
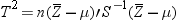
Let  and
and  be the sample mean and sample covariance matrix
of a random sample of size n from a bivariate normal distribution with mean
be the sample mean and sample covariance matrix
of a random sample of size n from a bivariate normal distribution with mean  and covariance matrix
  . The variable
  is distributed as a bivariate normal variate with
mean zero and covariance
is distributed as a bivariate normal variate with
mean zero and covariance  , and it is independent of . Using Hotelling’s
  statistic, which is defined as
and be the sample mean and sample covariance matrix
of a random sample of size n from a bivariate normal distribution with mean and covariance matrix . The variable is distributed as a bivariate normal variate with
mean zero and covariance , and it is independent of . Using Hotelling’s statistic, which is defined as


A prediction ellipse
is a region for predicting a new observation in the population. It
also approximates a region containing a specified percentage of the
population.


is distributed as a
bivariate normal variate with mean zero (the zero vector) and covariance  , and it is independent of . A
  prediction ellipse is then given by the equation
, and it is independent of . A prediction ellipse is then given by the equation

The family of ellipses
generated by different critical values of the  distribution has a common center (the sample mean)
and common major and minor axis directions.
distribution has a common center (the sample mean)
and common major and minor axis directions.
distribution has a common center (the sample mean)
and common major and minor axis directions.
The shape of an ellipse
depends on the aspect ratio of the plot. The ellipse indicates the
correlation between the two variables if the variables are standardized
(by dividing the variables by their respective standard deviations).
In this situation, the ratio between the major and minor axis lengths
is


Options
specifies the degree
of the transparency of the ellipse fill color and outline.
Tip: The FILLATTRS= option can be used to set transparency
for just the ellipse fill. You can combine this option with FILLATTRS=
to set one transparency for the ellipse outline but a different transparency
for the ellipse fill. Example:
datatransparency=0.2 fillattrs=(transparency=0.6)
specifies whether to
display an outlined ellipse, a filled ellipse, or an outlined and
filled ellipse.
specifies the appearance
of the interior fill area of the ellipse. See General Syntax for Attribute Options for the syntax
on using a style-element and Fill Options for available fill-options.
Interaction: For this option to have any effect, the fill must be enabled by
the ODS style or the DISPLAY= option.
Tip: The DATATRANSPARENCY= option sets the transparency for
the ellipse fill and ellipse outline. You can combine this option
with DATATRANSPARENCY= to set one transparency for the outline but
a different transparency for the fill. Example:
datatransparency=0.2 fillattrs=(transparency=0.6)
Specifies a numeric
column that provides frequencies for each observation read. If n is the value of the FREQ variable for a given observation,
then that observation is counted n times
in computing the ellipse.
specifies the attributes
of the ellipse outline. See General Syntax for Attribute Options for the syntax
on using a style-element and Line Options for available line-options.
Interaction: For this option to have any effect, the outlines must be enabled
by the ODS style or the DISPLAY= option.
specifies the type
of ellipse.
See also: For statistical details about how the ellipse is calculated, see Confidence and Prediction Ellipses .
specifies whether data
are mapped to the primary X (bottom) axis or to the secondary X2 (top)
axis.
Interaction: The overall plot specification and the layout type determine the
axis display. For more information, see How Axis Features Are Determined.
specifies whether data
are mapped to the primary Y (left) axis or to the secondary Y2 (right)
axis.
Interaction: The overall plot specification and the layout type determine the
axis display. For more information, see How Axis Features Are Determined.