Example Program and Statement Details

Example Graph

The following graph was generated by the Example Program:
drop lines at inflection point

Example Program

proc template;
  define statgraph dropline;
    begingraph;
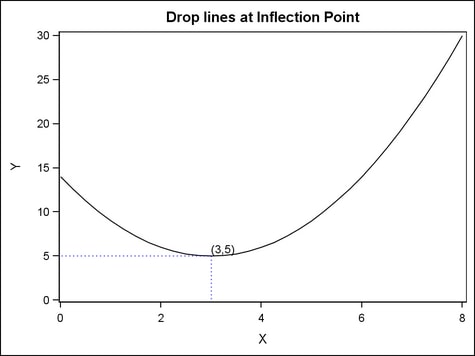
      entrytitle "Drop lines at Inflection Point";
      layout overlay / yaxisopts=(linearopts=(viewmin=0));
        seriesplot x=x y=y;
        dropline x=3 y=5 / dropto=x
         lineattrs=(color=blue pattern=dot) label="(3,5)";
        dropline x=3 y=5 / dropto=y
         lineattrs=(color=blue pattern=dot);
      endlayout;
   endgraph;
  end;
run;
 
data test;
  do X=0 to 8 by .25;
    Y=(x-3)*(x-3) + 5;
      output;
  end;
run;

proc sgrender data=test template=dropline;
run;

Statement Summary

A drop line is always drawn perpendicular from the specified point to the X (bottom), X2 (top), Y (left), or Y2 (right) axis. Axis offsets do not apply to drop lines, so they always meet the axis line.
The DROPTO= option controls whether a horizontal or vertical drop line is created. DROPTO=X specifies the horizontal axis for a vertical drop line, and DROPTO=Y specifies the vertical axis for a horizontal drop line.
A DROPLINE statement can be used only within a 2-D overlay-type layout (OVERLAY, OVERLAYEQUATED, PROTOTYPE). Another plot statement that is derived from data values that provide boundaries for the axis area must be included in the layout. For example, it can be used with a scatter plot or a histogram.
You can generate multiple drop lines by specifying a column for X and Y. The column type (numeric or string) must agree with the type of data presented on the axis.
To generate both a vertical and a horizontal drop line from a single point, use multiple DROPLINE statements. For example, the graph in the figure illustrates two DROPLINE statements originating from the same point (X=3, Y=5). One statement uses DROPTO=X and the other uses DROPTO=Y.

Required Arguments

X=x-axis-value | column | expression
specifies the X coordinate of the drop line(s).
Requirement: Values must agree in type with the X-axis data type. For example, you should use numeric SAS date or time values (or SAS date/time constants) for a time axis.
By default, if a specified value is outside of the X-axis data range, then the data range is extended to include the value. This behavior can be changed with the CLIP= option.
Y=y-axis-value | column | expression
specifies the Y coordinate of the drop line(s).
Requirement: Values must agree in type with the Y-axis data type.
By default, if a specified value is outside of the Y-axis data range, then the data range is extended to include the value. This behavior can be changed with the CLIP= option.

Options

Statement Option
Description
Specifies whether the data for the drop line(s) are considered when determining the data ranges for the axes.
Specifies the degree of the transparency of the drop line(s).
Specifies an amount to offset all drop lines from discrete X values, or discrete Y values, or both.
Specifies the axis to which the line is dropped.
Specifies a label for the point(s) indicated by X= and Y= options.
Specifies the color and font attributes of the drop line label.
Specifies a label for a legend.
Specifies the properties of the drop line(s).
Assigns a name to a plot statement for reference in other template statements.
Specifies whether data are mapped to the primary X (bottom) axis or the secondary X2 (top) axis.
Specifies whether data are mapped to the primary Y (left) axis or the secondary Y2 (right) axis.
CLIP=boolean
specifies whether the data for the line are considered when determining the data ranges for the axes.
Default: FALSE
FALSE
The data for the line contribute to the data range for each axis. Each axis might be extended to force the display of the line.
TRUE
The data for the line are ignored when establishing axis scales. Each axis scale is determined by the other plots in the parent layout. This might result in the line not being displayed if its data range is not within the data ranges of the other plots.
DATATRANSPARENCY=number
specifies the degree of the transparency of the drop line.
Default: 0
Range: 0 (opaque) to 1 (entirely transparent)
DISCRETEOFFSET= number
specifies an amount to offset all drop lines from discrete X values, or Y values, or both.
Default: 0 (no offset, all drop lines are centered on discrete X values, or discrete Y values, or both)
Range: -0.5 to +0.5 where .5 represents half the distance between discrete ticks. If the X axis is discrete, a positive offset is to the right. If the Y axis is discrete, a positive offset is up. If REVERSE=TRUE on the X or Y axis, then the offset direction is also reversed.
DROPTO=X | Y
specifies the axis to which the line is dropped.
Default: X
X
Draws dropline(s) to an X axis. The XAXIS== option determines whether the X or X2 axis is the endpoint for the line.
Y
Draws dropline(s) to a Y axis. The YAXIS== option determines whether the Y or Y2 axis is the endpoint for the line.
LABEL="string" | string-column
specifies a label for the point(s) indicated by the X= and Y= arguments.
Default: no label is specified
Interaction: If drawing multiple droplines using X=column or Y=column, you can assign corresponding labels by using a column to define the labels.
The font and color attributes for the label are specified by the LABELATTRS= option.
LABELATTRS=style-element | style-element (text-options) | (text-options)
specifies the color and font attributes of the drop line label(s). See General Syntax for Attribute Options for the syntax on using a style-element and Text Options for available text-options.
Default: The GraphValueText style element.
Interaction: For this option to have any effect, the LABEL= option must also be specified.
LEGENDLABEL= "string"
specifies a label for the legend item that is associated with this plot.
Default: The string specified on the NAME= option.
Restriction: This option applies only to an associated DISCRETELEGEND statement.
LINEATTRS=style-element | style-element (line-options) | (line-options)
specifies the attributes of the drop line. See General Syntax for Attribute Options for the syntax on using a style-element and Line Options for available line-options.
Default: The GraphReference style element.
NAME="string"
assigns a name to a plot statement for reference in other template statements.
Default: no default
Restriction: The string is case sensitive, cannot contain spaces, and must define a unique name within the template.
Interaction: The string is used as the default legend label if the LEGENDLABEL= option is not used.
The specified name is used primarily in legend statements to coordinate the use of colors and line patterns between the graph and the legend.
XAXIS=X | X2
specifies whether data are mapped to the primary X (bottom) axis or to the secondary X2 (top) axis.
Default: X
Restriction: Another plot that establishes a data range for the designed axis must be included.
Interaction: The overall plot specification and the layout type determine the axis display. For more information, see How Axis Features Are Determined.
YAXIS=Y | Y2
specifies whether data are mapped to the primary Y (left) axis or to the secondary Y2 (right) axis.
Default: Y
Restriction: Another plot that establishes a data range for the designed axis must be included.
Interaction: The overall plot specification and the layout type determine the axis display. For more information, see How Axis Features Are Determined.