Example Program and Statement Details
Statement Summary
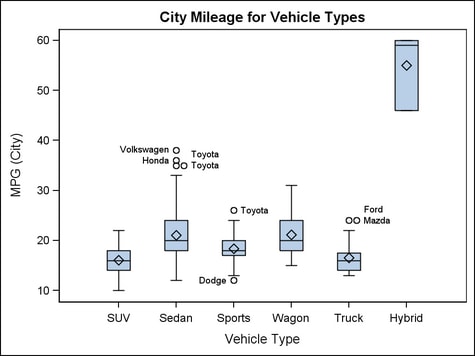
The BOXPLOT
statement displays a single box if given just a Y argument. It displays
multiple boxes if given both Y and X arguments and X has more than
one unique value. For numeric or character columns, the X-axis is
always of TYPE=DISCRETE.
Two basic
box plot representations can be drawn with the BOXPLOT statement:
a schematic (Tukey) box plot and a skeletal box plot.
See the EXTREME= option for details.
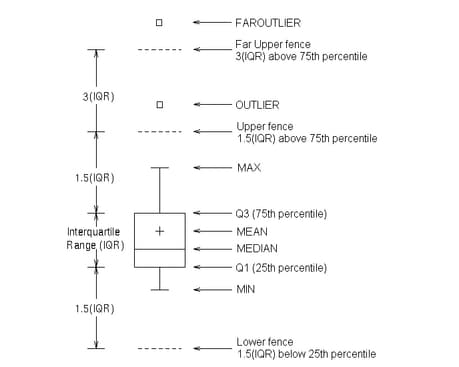
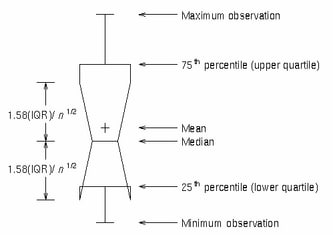
As shown
in the figure, the bottom and top edges of the box are located at
the 25th and 75th percentiles of the sample. Within the box you can
display the median (50th percentile) as a line and the mean as a marker
(see DISPLAY= option).
You can
also display markers and data labels for outliers. Outliers are observations
that are more extreme than the upper and lower fences (  ). Outliers that are beyond upper and lower far
fences (
). Outliers that are beyond upper and lower far
fences (  ) are called FAR OUTLIERS and can also be identified
and labeled. From a graphical perspective, the location of fences
along the axis are known, but there is no line or marker that displays
a fence. (See DISPLAY=, LABELFAR=, and DATALABEL= options).
) are called FAR OUTLIERS and can also be identified
and labeled. From a graphical perspective, the location of fences
along the axis are known, but there is no line or marker that displays
a fence. (See DISPLAY=, LABELFAR=, and DATALABEL= options).
). Outliers that are beyond upper and lower far
fences ( ) are called FAR OUTLIERS and can also be identified
and labeled. From a graphical perspective, the location of fences
along the axis are known, but there is no line or marker that displays
a fence. (See DISPLAY=, LABELFAR=, and DATALABEL= options).
Finally,
you can control the range represented by the whiskers. By default,
the whiskers are drawn from the upper edge of the box to the MAX value,
and from the lower edge of the box to the MIN value (see EXTREME= option).
Options
specifies the shape
at the ends of the whiskers.
Interaction: The cap color and the thickness are specified by the WHISKERATTRS= option. The cap pattern is always
solid.
specifies that a connect
line joins a statistic from box to box.
Requirement: The DISPLAY= option must contain the CONNECT suboption
for the connect line to be displayed.
specifies the attributes
of the lines connecting multiple boxes. See General Syntax for Attribute Options for the syntax
on using a style-element and Line Options for available line-options.
specifies the color
and font attributes of the outlier labels. See General Syntax for Attribute Options for the syntax
on using a style-element and Text Options for available text-options.
specifies an amount
to offset all boxes from the discrete X ticks.
Range: -0.5 to +0.5, where .5 represents half the distance between discrete
ticks. A positive offset is to the right when ORIENT=VERTICAL, and
up when ORIENT=HORIZONTAL. (If the layout's axis options set REVERSE=TRUE,
then the offset direction is also reversed.)
Details: This feature is useful for graphing multiple response variables
side by side on a common axis. By default within an overlay-type layout,
if multiple BOXPLOT statements are used with different analysis variables,
the boxes for matching X values are centered on the ticks. Depending
on the data, the boxes might be superimposed. The following code fragment
shows the default box positioning:
layout overlay / cycleattrs=true
    yaxisopts=(label="Miles Per Gallon");

  boxplot x=type y=mpg_city    / name="City";
  boxplot x=type y=mpg_highway / name="Highway";

  discretelegend "City" "Highway";
endlayout;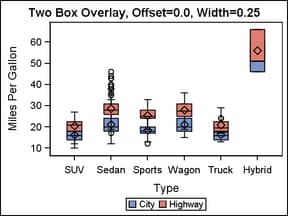
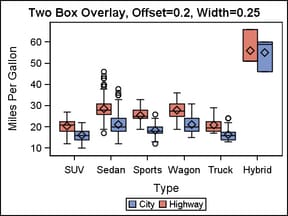
To place the different
response values side by side, you can assign a different offset to
each BOXPLOT statement. The BOXWIDTH= option can be used in conjunction
with the DISCRETEOFFSET= option to create narrower boxes when desired.
layout overlay / cycleattrs=true
    yaxisopts=(label="Miles Per Gallon");

  boxplot x=type y=mpg_city    / name="City"
    discreteoffset=.2 ;
  boxplot x=type y=mpg_highway / name="Highway"
    discreteoffset=-.2 ;

  discretelegend "City" "Highway";
endlayout;
specifies which additional
features of the box plot to display.
Default: The GraphBox:DisplayOpts style reference. If this style element
does not exist, the default is STANDARD.
a list of features,
enclosed in parentheses, to be displayed. The list can include any
of the following:
| CAPS | displays caps at the ends of the whiskers |
| CONNECT | displays the line connecting multiple boxes |
| FILL | displays filled boxes |
| MEAN | displays the mean symbol within the box |
| MEDIAN | displays the median line within the box |
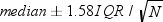
| NOTCHES | displays notched boxes |
| OUTLIERS | displays markers for the outliers |
To control the appearance
of these features, use the CONNECTATTRS=, FILLATTRS=, MEANATTRS=, MEDIANATTRS=, OUTLIERATTRS=, and WHISKERATTRS= options. The WHISKERATTRS= option
controls affects both CAPS and WHISKERS.
specifies whether the
whiskers can extend beyond the fences.
Interaction: This option overrides the DATALABEL=, DATALABELATTRS=, LABELFAR=, OUTLIERATTRS=, and SPREAD= options.
Fences are locations
above and below the box. The upper and lower fences are located at
a distance 1.5 times the Interquartile Range (IQR) ( IQR = Q3 - Q1
). The upper and lower far fences are located at a distance 3 times
the IQR (see Example Program and Statement Details).
specifies the appearance
of the interior fill area of the boxes. See General Syntax for Attribute Options for the syntax
on using a style-element and Fill Options for available fill-options.
Interaction: For this option to have any effect, the fill must be enabled by
the ODS style or the DISPLAY= option.
specifies a numeric
column that provides frequencies for each observation read. If n is the value of the numeric-column for a given observation, then that observation is used n times for any statistical computation.
specifies whether all
outliers or only far outliers are labeled. For more information about
outliers, see the Example Program and Statement Details.
the labels specified
by the DATALABEL= option apply to both outliers and
far outliers.
specifies the attributes
of the marker representing the mean within the box. See General Syntax for Attribute Options for the syntax
on using a style-element and Marker Options for available marker-options.
specifies the appearance
of the line representing the median within the box. See General Syntax for Attribute Options for the syntax
on using a style-element and Line Options for available line-options.
specifies the attributes
of the markers representing the outliers. See General Syntax for Attribute Options for the syntax
on using a style-element and Marker Options for available marker-options.
specifies the appearance
of the box outline. See General Syntax for Attribute Options for the syntax
on using a style-element and Line Options for available line-options.
specifies one of five
definitions used to calculate percentiles.
The percentile definitions
and default are the same as used by PCTLDEF= option of PROC UNIVARIATE
or the QNTLDEF= option of PROC SUMMARY.
Calculating Percentiles: You
can specify one of five definitions for computing the percentiles
with the PERCENTILE= option. Let  be the number of nonmissing values for a variable,
and let
be the number of nonmissing values for a variable,
and let  ,
,  , ...,
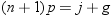
  represent the ordered values of the variable. is the smallest value, is the next smallest, and is the largest value. Let the
  th percentile be
  , set
, set  , and let
be the number of nonmissing values for a variable,
and let , , ..., represent the ordered values of the variable. is the smallest value, is the next smallest, and is the largest value. Let the th percentile be , set , and let
 when PERCENTILE=1, 2, 3, or 5
 when PERCENTILE=4
 is the integer part of
  , and
, and  is the fractional part of
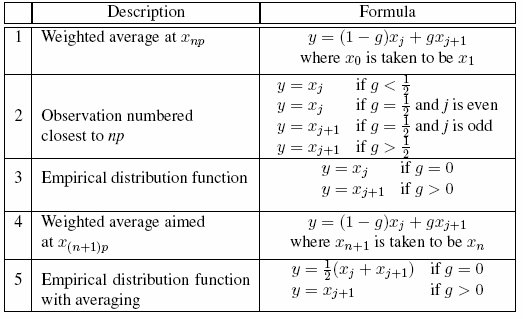
specifies that the
data columns for this plot and the plot type be used for determining
default axis features.
Details: This option is needed only when two or more plots within an overlay-type
layout contribute to a common axis. For more information, see When Plots Share Data and a Common Axis
specifies whether outliers
with the same value are spread out to avoid overlap. For vertical
box plots this means offsetting the outliers horizontally. If this
option is false, outliers with the same value are plotted in the same
position. Thus, only one is visible
specifies the line
properties of the whiskers and caps. See General Syntax for Attribute Options for the syntax
on using a style-element and Line Options for available line-options.
specifies whether data
are mapped to the primary X (left) axis or to the secondary X2 (right)
axis.
Interaction: The overall plot specification and the layout type determine the
axis display. For more information, see How Axis Features are Determined.
specifies whether data
are mapped to the primary Y (bottom) axis or to the secondary Y2 (top)
axis.
Interaction: The overall plot specification and the layout type determine the
axis display. For more information, see How Axis Features are Determined.