Example Program and Statement Details
A block plot contains information about X locations
and text values to be associated with corresponding intervals along
the X axis. There is no Y axis information in this plot.
BlockPlot Overlaid with SeriesPlot
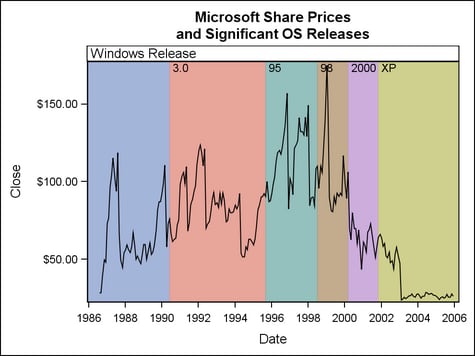
When overlaid
with plots that have a Y axis—a series plot for example—a
block plot expands vertically to fill the Y axis range. In the BLOCKPLOT
statement, the BLOCK= argument can be used to reference text values
from a column. The resulting graph displays those values within the
plot wall.
The following
example shows how a block plot can be specified with a series plot
within an Overlay layout. To prepare data for the graph, “event”
information is added to existing data for stock prices. Notice that
the first DATA step creates a RELEASE column. That column is later
specified on the BLOCK= argument to display text values on the wall
of the block plot.
data MSevents;
  input Date date9. Release $5.;
  label Release="Windows Release";
datalines;
01jun1990 3.0
01sep1995 95
01jul1998 98
01mar2000 2000
01nov2001 XP
run;

proc sort data=sashelp.stocks(keep=date stock close)
  out=MSstock;
  where stock="Microsoft";
  by date;
run;

data events(drop=temp);
  retain temp;
  merge MSstock MSevents(in=r);
  by date;
  if first.date and r then temp=release;
  release=temp;
run;
In the
combined input data set, notice that the RELEASE value is repeated
for each observation within the duration of a defined “event”:
Obs    Date      Close   Release
...
45    02APR90   $58.00
46    01MAY90   $73.00
47    01JUN90   $76.00     3.0
48    02JUL90   $66.50     3.0
49    01AUG90   $61.50     3.0
50    04SEP90   $63.00     3.0
...
In the
following GTL template code, BLOCK=RELEASE is specified in the BLOCKPLOT
statement so that the RELEASE values are displayed on the wall of
the resulting block plot.
proc template;
  define statgraph blockplot1;
    begingraph;
      entrytitle "Microsoft Share Prices";
      entrytitle "and Significant OS Releases";
       layout overlay;
         blockplot x=date block=release /
           datatransparency=.3 valuevalign=top
           labelposition=top display=(fill values label);
        seriesplot x=date y=close;
      endlayout;
    endgraph;
  end;
run;

proc sgrender data=events template=blockplot1;
run;
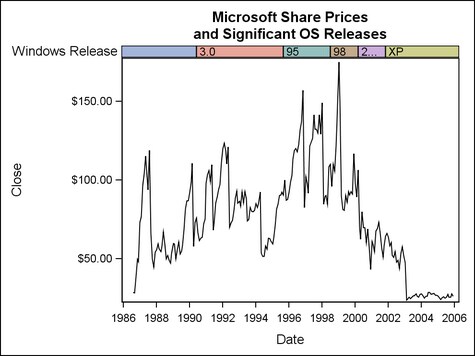
Stand-alone BlockPlot in Lattice Layout
When used
as a stand-alone plot in a lattice layout, the block plot’s
height can be controlled. Here the lattice ROWWEIGHTS=(.04 .96) option
apportions 4% of the vertical space to the block plot. Using this
technique, it is possible to include two or more “event”
strips in a plot.
proc template;
  define statgraph blockplot2;
    begingraph;
      entrytitle "Microsoft Share Prices";
      entrytitle "and Significant OS Releases";
      layout lattice / rowweights=(.04 .96);
        blockplot x=date block=release / datatransparency=.3
          valuefitpolicy=shrink  labelposition=left
          display=(fill label outline values);
        seriesplot x=date y=close;
      endlayout;
    endgraph;
  end;
run;

proc sgrender data=events template=blockplot2;
run;
Arguments
Options
specifies the appearance
of alternate fills. This option in conjunction with the FILLATTRS= option controls fill appearance when
FILLTYPE=ALTERNATE. See General Syntax for Attribute Options for the syntax
on using a style-element and Fill Options for available fill-options.
Interaction: For this option to have any effect, the fill must be enabled by
the ODS style or the DISPLAY= option.
To make all block
fill areas the same color, set the FILLATTRS= and ALTFILLATTRS= options to the same value.
specifies indices for
remapping the assignment of the color of the block fills.
Interaction: All of the indexes for a specific block value must be the same.
Otherwise, the results are unpredictable.
creates a separate
block plot for each unique value of the specified column or expression.
Each block plot is labeled externally by the class value.
The font and color
attributes for the external labels are specified by the LABELATTRS= option.
specifies whether to
display an outlined, a filled, or an outlined and filled block area.
Values and a label can also be added or suppressed.
Use the OUTLINEATTRS=, FILLATTRS=, ALTFILLATTRS=, and BLOCKINDEX= options to control the appearance
of the blocks.
specifies the appearance
of the block fills. This option in conjunction with the ALTFILLATTRS= option controls fill appearance when FILLTYPE=ALTERNATE. See General Syntax for Attribute Options for the syntax
on using a style-element and Fill Options for available fill-options.
Interaction: For this option to have any effect, the fill must be enabled by
the ODS style or the DISPLAY= option.
To make all block
fill areas the same color, set the FILLATTRS= and ALTFILLATTRS= options to the same value.
specifies how the blocks
are filled.
Blocks are filled with
the COLOR attribute of the style elements GraphData1 - GraphDataN
or the style elements indicated by the BLOCKINDEX= column.
Blocks are filled alternating
between the colors specified by the FILLATTRS= and ALTFILLATTRS= options.
Interaction: For this option to have any effect, the fill must be enabled by
the ODS style or the DISPLAY= option.
specifies an external
label for a single block plot.
-
The variable label of the BLOCK= column.
The font and color
attributes for the external label are specified by the LABELATTRS= option.
specifies the color
and font attributes of the external block label(s). See General Syntax for Attribute Options for the syntax
on using a style-element and Text Options for available text-options.
specifies the appearance
of the block outlines. See General Syntax for Attribute Options for the syntax
on using a style-element and Line Options for available line-options.
Interaction: For this option to have any effect, the outlines must be enabled
by the ODS style or the DISPLAY= option.
specifies the appearance
of the text values. See General Syntax for Attribute Options for the syntax
on using a style-element and Text Options for available text-options.
specifies the horizontal
alignment of the text within the blocks.
Interaction: When REPEATEDVALUES=TRUE and X values are numeric, only
CENTER and START can be used for a discrete axis, and only LEFT and
START can be used for a linear or log axis. For example, if REPEATEDVALUES=TRUE
and the axis is discrete, a setting of RIGHT for this option is ignored
and LEFT is used instead.
specifies whether data
are mapped to the primary X (bottom) axis or to the secondary X2 (top)
axis.
Interaction: The overall plot specification and the layout type determine the
axis display. For more information, see How Axis Features are Determined.