Example Program and Statement Details
Example Program
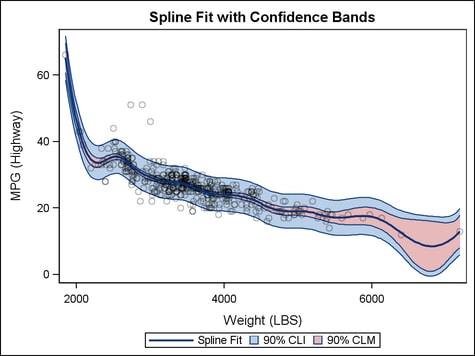
proc template;
 define statgraph modelband;
  begingraph;
   entrytitle "Spline Fit with Confidence Bands";
   layout overlay;
     modelband "cliband" / name="confband1" display=all
       legendlabel="90% CLI" fillattrs=GraphConfidence;
     modelband "clmband" / name="confband2" display=all
       legendlabel="90% CLM" fillattrs=GraphConfidence2;
     scatterplot x=weight y=mpg_highway /
       datatransparency=.7;
     pbsplineplot x=weight y=mpg_highway / name="fitline"
       clm="clmband" cli="cliband"
       alpha=.1 legendlabel="Spline Fit";
     discretelegend "fitline" "confband1" "confband2";
   endlayout;
  endgraph;
 end;
run;

proc sgrender data=sashelp.cars template=modelband;
run;
Options
specifies the color
and font attributes of the upper and lower band labels. See General Syntax for Attribute Options for the syntax
on using a style-element and Text Options for available text-options.
Interaction: For this option to take effect, the CURVELABELLOWER= or CURVELABELUPPER= option must also be specified.
specifies a label for
the lower band limit.
The font and color
attributes for the label are specified by the CURVELABELATTRS= option.
specifies a label for
the upper band limit.
The font and color
attributes for the label are specified by the CURVELABELATTRS= option.
specifies the location
of the band labels relative to the plot area.
Restriction: OUTSIDE cannot be used when the MODELBAND is used in multi-cell
layouts such as LATTICE, DATAPANEL, or DATALATTICE, where axes might
be external to the grid.
Interaction: This option is used in conjunction with the CURVELABELPOSITION= option to determine where the band
labels appear. For more information, see Location and Position of Curve Labels.
Interaction: For this option to take effect, the CURVELABELLOWER= or CURVELABELUPPER= option must also be specified.
specifies the position
of the band label relative to the band line.
Interaction: For this option to take effect, the CURVELABELLOWER= or CURVELABELUPPER= option must also be specified.
Restriction: The AUTO setting is not supported if CURVELABELLOCATION=INSIDE is
specified. The START and END settings are not supported if CURVELABELLOCATION=OUTSIDE
is specified.
Interaction: This option is used in conjunction with the CURVELABELLOCATION=
option to determine where the band label appears. For more information,
see Location and Position of Curve Labels.
specifies whether to
display an outlined area, a filled area, or an outlined and filled
modelband area.
specifies the appearance
of the filled modelband area. See General Syntax for Attribute Options for the syntax
on using a style-element and Fill Options for available fill-options.
Interaction: For this option to have any effect, the fill must be enabled by
the ODS style or the DISPLAY= option.
specifies the attributes
of the modelband outlines. See General Syntax for Attribute Options for the syntax
on using a style-element and Line Options for available line-options.
specifies whether data
are mapped to the primary X (bottom) axis or to the secondary X2 (top)
axis.
Interaction: The overall plot specification and the layout type determine the
axis display. For more information, see How Axis Features are Determined.
The setting for this
option should be the same as for the smoother statement referenced
by "confidence-name" .
specifies whether data
are mapped to the primary Y (left) axis or to the secondary Y2 (right)
axis.
Interaction: The overall plot specification and the layout type determine the
axis display. For more information, see How Axis Features are Determined.
The setting for this
option should be the same as for the smoother statement referenced
by "confidence-name" .