Example Program and Statement Details
Example Program
The BEGINGRAPH
statement block is a required outermost container for any graph template.
One if its purposes is to support options that control the graph size.
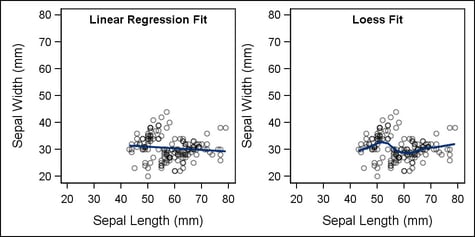
When you know that the default graph a template produces is better
viewed with a different size or aspect ratio, you can declare default
sizing information. To do so, use the DESIGNWIDTH= option, or the
DESIGNHEIGHT= option, or both. This program shows one way to set the
width and height of two graph cells to be equal.
proc template;
  define statgraph begingraph;
    dynamic XVAR YVAR;
    begingraph / designwidth=640px designheight=320px;
    layout lattice / columns=2;
      layout overlayequated / equatetype=square;
        entry "Linear Regression Fit" /
          valign=top texttattrs=(weight=bold);
        scatterplot x=XVAR y=YVAR / datatransparency=.5;
        regressionplot x=XVAR y=YVAR;
      endlayout;
      layout overlayequated / equatetype=square;
        entry "Loess Fit" /
          valign=top texttattrs=(weight=bold);
        scatterplot x=XVAR y=YVAR / datatransparency=.5;
        loessplot x=XVAR y=YVAR;
      endlayout;
    endlayout;
    endgraph;
  end;
run;

proc sgrender data=sashelp.iris template=begingraph;
  dynamic title="Square Plot"
    xvar="SepalLength" yvar="SepalWidth";
run;
Statement Summary
All template
definitions in the Graphics Template Language must start with a BEGINGRAPH
statement and conclude with an ENDGRAPH statement.
Within
a BEGINGRAPH block, at least one GTL-layout-block is required. It can be a LATTICE, GRIDDED, OVERLAY, OVERLAYEQUATED,
OVERLAY3D, DATALATTICE, or DATAPANEL layout block. This layout block
should contain at least one plot statement.
The GTL-global-statements include one or more ENTRYTITLE,
ENTRYFOOTNOTE, or IF / ELSEIF/ ELSE statements. Any of these global
statements can precede or follow the GTL-layout-block.
By default,
graphs are rendered at 640px by 480px (4:3 aspect ratio). To change
the graph size for the output of a single BEGINGRAPH block, use the DESIGNWIDTH= and DESIGNHEIGHT= options on that BEGINGRAPH statement.
For example, the template in the Example Program uses DESIGNHEIGHT= to change the graph height to 320px.
To prevent the graph width from automatically scaling to preserve
the 4:3 aspect ratio, it uses DESIGNWIDTH= to maintain the 640px width.
The setting ensures that each graph cell is square (320px by 320px).
Note: To change the
graph sizes for all templates in the current SAS session, use the
WIDTH= and HEIGHT= options in the ODS GRAPHICS statement. Size settings
in the ODS GRAPHICS statement override size settings in the BEGINGRAPH
statement and remain in effect unless they are changed on another
ODS GRAPHICS statement.
The following
template defines a square graph (equal height and width, 1:1 aspect
ratio) by setting the design width equal to the internal default height
(480px). The setting is made with DESIGNWIDTH=DEFAULTDESIGNHEIGHT:
proc template;
  define statgraph squareplot;
    dynamic title xvar yvar;
    begingraph / designwidth=defaultDesignHeight;
      entrytitle title;
      layout overlayequated / equatetype=square;
        scatterplot x=xvar y=yvar;
        regressionplot x=xvar y=yvar;
      endlayout;
    endgraph;
  end;
run;
If this
template were executed with the following GRENDER procedure statement,
a 480px by 480px graph would be created:
proc sgrender data=mydata template="squareplot" ;
dynamic title="Square Plot" xvar="time1" yvar="time2";
run;
Options
specifies the attributes
of the border line around the graph. See General Syntax for Attribute Options for the syntax
on using a style-element and Line Options for available line-options.
specifies the design
height of the graph.
Default: DEFAULTDESIGNHEIGHT. This value is obtained from the SAS Registry
key Products GraphODSStatGraphDefaultDesignHeight when the graph is
rendered. The initial value of this registry key is 640px.
GraphODSStatGraphDefaultDesignHeight when the graph is
rendered. The initial value of this registry key is 640px.
specifies the design
width of the graph.
Default: DEFAULTDESIGNWIDTH. This value is obtained from the SAS Registry
key ProductsGraphODSStatGraphDefaultDesignWidth when the graph is
rendered. The initial value of this registry key is 480px.
specifies the amount
of extra space that is added inside the graph border.
Default: The default padding for all sides is 10. Values without units are
in pixels (px). A unit must be provided if other than pixels.
Enables separate settings
for the left, right, top, and bottom padding dimensions. Use the pad-options to create non-uniform padding. These
options must be enclosed in parentheses. Each option is specified
as a name = value pair. Sides
not assigned padding are padded with the default amount.
| LEFT=dimension | specifies the amount of extra space added to the left side. |
| RIGHT=dimension | specifies the amount of extra space added to the right side. |
| TOP=dimension | specifies the amount of extra space added to the top. |
| BOTTOM=dimension | specifies the amount of extra space added to the bottom. |