Example: Create a Shared-Variable Graph and Add a Dynamic Title
About This Example
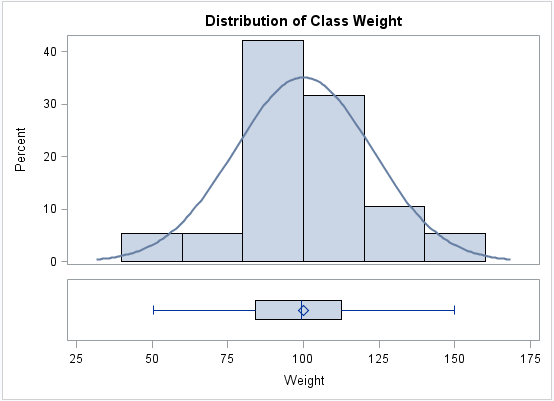
In this example, you
create a graph that is similar to the previous example. The graph
has two cells with different types of plots. The main distinction
is that this example uses a shared variable. Shared variables make
it easy to change the data that is used in the graph.
Step Four: Change the Height of the Cells


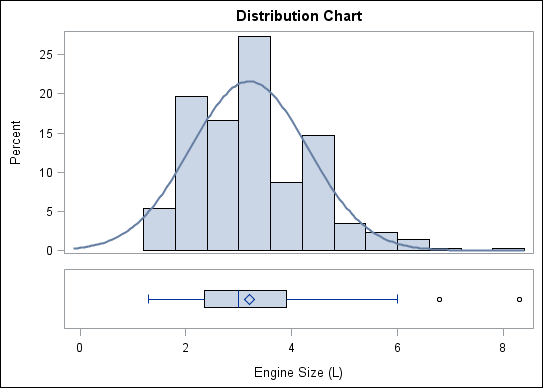
Step Eight: Change the Graph Variable from Horsepower to Engine Size
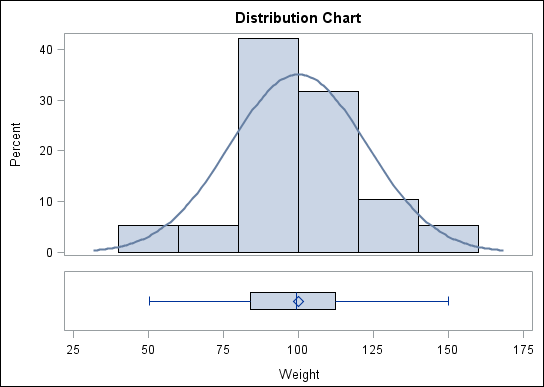
Step Nine: Change the Data Set
Step Ten: Add Dynamic Content to the Title
So far this example
has used a generic title. Suppose that you want the title to more
accurately reflect the data this is used for the graph. You can use
dynamic content in the title.
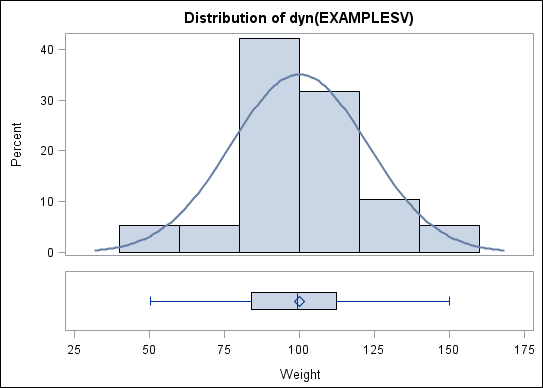
Step Eleven: Generate the Graph by Using the SGDESIGN Procedure
In the SGDESIGN procedure,
you use the DYNAMIC option to provide the text to substitute for the dyn(EXAMPLESV) expression.
For more information
about the SGDESIGN procedure, see SGDESIGN Procedure in SAS ODS Graphics: Procedures Guide.