The graph
that you design here contains a histogram and a normal density curve.
To create the graph:
-
Select
File NewBlank
Graph
NewBlank
Graph.
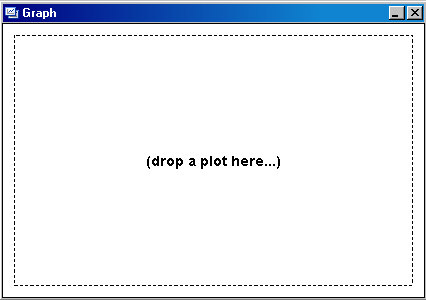
An empty
graph appears with the text “drop a plot here...”.
-
From the
Plot Layers panel of the
Elements pane, click and drag the Histogram icon to the blank row in your
graph. (If the
Elements pane is not visible,
select
ViewElements to display it.) The Histogram icon looks like this:
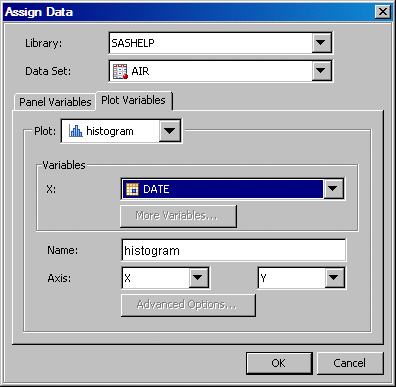
The Assign
Data dialog box opens.
-
In the
Assign Data dialog box, select the following:
Select SASHELP from the list box.
Select AIR from the list box.
Select DATE from the list box.
-
From the
Plot Layers panel, click and drag the Normal icon to
the graph. The Normal icon looks like this:
The Assign
Data dialog box opens.
-
In the
Assign Data dialog box, keep the default selections. Then click
OK.
Note that
you cannot change the library and data set. You cannot specify different
data for a plot that is overlaid on another plot.
-
Click

in the toolbar to add a title. The following text
box displays at the top of the graph:
-
In the
text box, type
Air Travel by Year.
-
(Optional)
Save the graph.
For instructions, see Save a Graph.