Add a Plot to a Graph
When you
select a graph from the Graph Gallery, the graph already contains
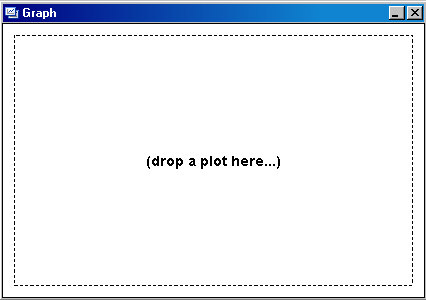
one or more plots. If you create a new blank graph or add cells (rows
or columns) to an existing graph, then you must manually add a plot
to the graph cell. The empty cell contains the text “drop a
plot here...”.
Note: You cannot
add plots to matrix graphs that you create from the Matrix tab of the Graph Gallery.
-
Specify the data for the plot, and then click OK. For more information, see Assigning Data to a Plot.
Note: The Plot Layers panel also contains reference lines that
you can add to a graph. When you click and drag a reference line,
the line is placed in a location near the cursor. A dialog box opens
in which you can specify the position value and other settings. After
you add the line, you can move the line to a different location. When
you position the cursor over the line, the cursor changes to a two-headed
arrow  . You can then click and drag the line to the new
location.
. You can then click and drag the line to the new
location.