Animating Output with the SVGANIM Printer
You can use the SVGANIM
universal printer to create a single SVG file that displays a sequence
of images. These animated sequences are commonly referred to as slide
shows. By default, the display sequence repeats until you click the
Pause button in the browser or until you display another Web page.
- DELAY=delay
-
specifies the duration of the transition (fade in) between images. Specify the delay in hundredths of a second.
- ITERATION=0 | 1
-
specifies whether the slide show displays only once or repeats continuously. The default value is 0, which repeats the slide show continuously. A value of 1 displays the slide show only once.


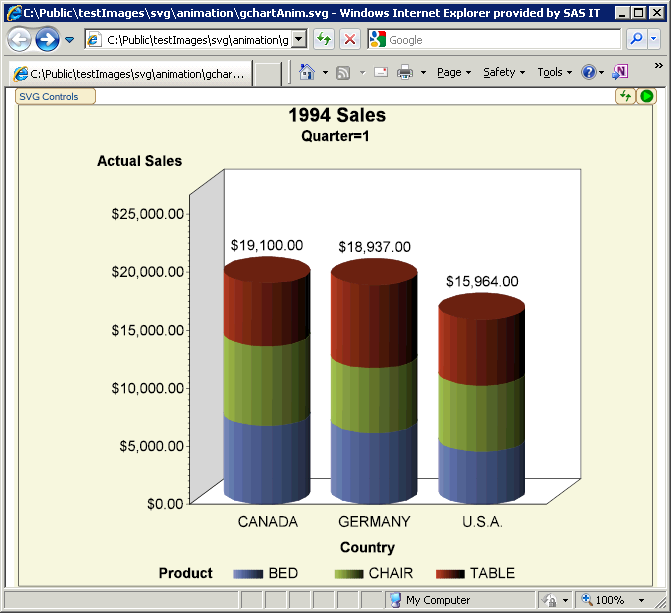
The following display
shows an image from the SVG slide show created by the example code
shown in Creating a Slide Show Using the SVGANIM Universal Printer.
Creating a Slide Show Using the SVGANIM Universal Printer
/* Close the HTML destination */
/* to conserve resources.     */

ods html close;

/* Set the graphic environment. The DELAY= */
/* option sets the amount of time between  */
/* graphs in the animation sequence.       */

goptions reset=all delay=100 htext=1.5 htitle=2;
options nodate nonumber;

/* Open the printer destination, specify  */
/* the svganim printer, change the style. */

ods printer file="svgAnim.svg" printer=svganim style=harvest;

/* Create a data set by extracting data */
/* from sashelp.prdsale. Keep only the  */
/* columns needed for the graphs.       */

data work.qsales;
set sashelp.prdsale (keep=Actual Country Product Quarter Year);
run;

/* Sort the data by quarter. When using */
/* BY groups, the data must be sorted   */
/* according to the BY variable.        */

proc sort data=work.qsales;
by quarter;
run;

/* Set the major tick mark interval */
/* on the vertical axis.            */

axis1 order=(0 to 25000 by 5000);

/* Generate graphs for 1993. */

title1 "1993 Sales";
proc gchart data=work.qsales(where=(year=1993));
vbar3d country / sumvar=actual subgroup=product sum
       raxis=axis1 shape=cylinder;
where product in ("BED" "TABLE" "CHAIR");
by quarter;
run;
quit;


/* Generate graphs for 1994. */

title1 "1994 Sales";
proc gchart data=work.qsales(where=(year=1994));
vbar3d country / sumvar=actual subgroup=product sum
       raxis=axis1 shape=cylinder;
where product in ("BED" "TABLE" "CHAIR");
by quarter;
run;
quit;

/* Close the printer destination and reopen the HTML   */
/* destination. Closing the printer destination closes */
/* the output file.                                    */

ods printer close;
ods html;