Example 4: Creating and Modifying Box Plots
| Features: |
GOTIONS statement options: BORDER
|
| Sample library member: | GSYCMBP1 |
This example shows how
to create box plots and how to specify SYMBOL definitions so that data outside the
box-plot range can be represented with data points. It also shows
how to change a box plot's percentile range to see whether the new
range encompasses the data.
Program
goptions reset=all border;
data grades;
     input section $ grade @@;
     datalines;
A 74 A 89 A 91 A 76 A 87 A 93 A 93 A 96 A 55
B 72 B 72 B 84 B 81 B 97 B 78 B 88 B 90 B 74
C 62 C 74 C 71 C 87 C 68 C 78 C 80 C 85 C 82
;
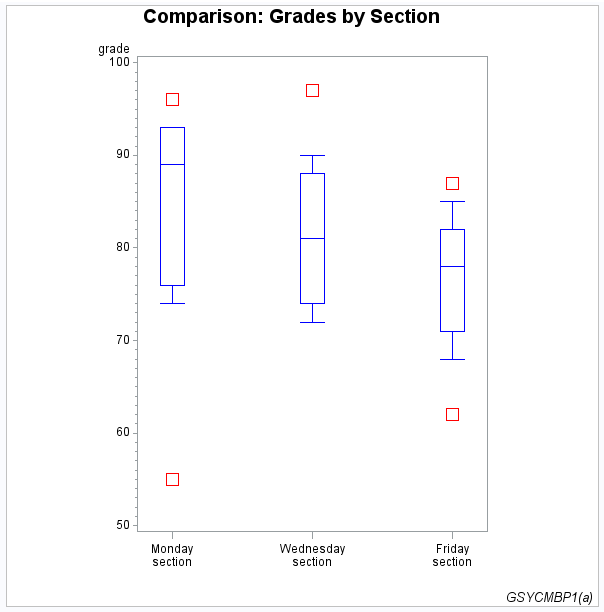
title1 "Comparison: Grades by Section";
footnote1 j=r  "GSYCMBP1(a) ";
symbol interpol=boxt20 /* box plot              */
       co=blue         /* box and whisker color */
       bwidth=4        /* box width             */
       value=square    /* plot symbol           */
       cv=red          /* plot symbol color     */
       height=2;       /* symbol height         */
axis1 label=none
      value=(t=1 "Monday" j=c "section"
             t=2 "Wednesday" j=c "section"
             t=3 "Friday" j=c "section")
      offset=(5,5)
      length=50;
proc gplot data= grades;
   plot grade*section / haxis=axis1
                        vaxis=50 to 100 by 10;
run;
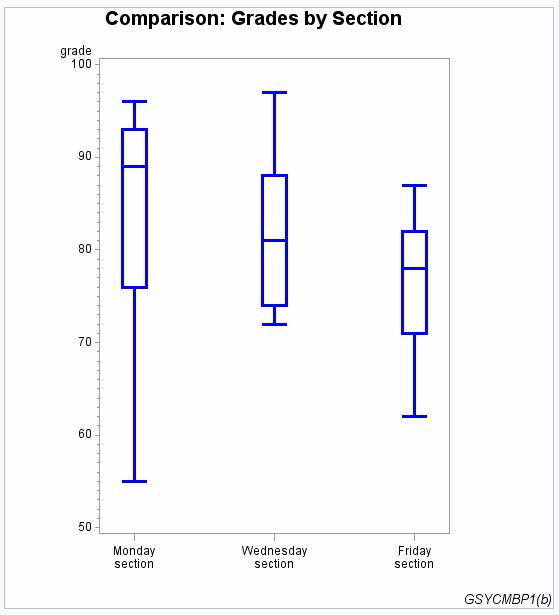
footnote j=r GSYCMBP1(b);
symbol interpol=boxt10 width=2;
plot grade*section / haxis=axis1
                        vaxis=50 to 100 by 10;
run;
quit;
Program Description
Create the data set. GRADES
contains codes to identify each class section, and the grades scored
by students in each section.
data grades;
     input section $ grade @@;
     datalines;
A 74 A 89 A 91 A 76 A 87 A 93 A 93 A 96 A 55
B 72 B 72 B 84 B 81 B 97 B 78 B 88 B 90 B 74
C 62 C 74 C 71 C 87 C 68 C 78 C 80 C 85 C 82
;
Define symbol characteristics. INTERPOL=BOXT20
specifies a box plot with tops and bottoms on its whiskers, and the
high and low bounds at the 80th and 20th percentiles. The CO= option
colors the boxes and whiskers. The BWIDTH= option affects the width
of the boxes. The VALUE= option specifies the plot symbol that marks
the data points outside the range of the box plot. The CV= option
colors the plot symbols. The HEIGHT= option specifies a symbol size.
symbol interpol=boxt20 /* box plot              */
       co=blue         /* box and whisker color */
       bwidth=4        /* box width             */
       value=square    /* plot symbol           */
       cv=red          /* plot symbol color     */
height=2; /* symbol height */axis1 label=none
value=(t=1 "Monday" j=c "section"
t=2 "Wednesday" j=c "section"
t=3 "Friday" j=c "section")
offset=(5,5)
length=50;