The EXPAND Procedure
- Overview
-
Getting Started
 Converting to Higher Frequency SeriesAggregating to Lower Frequency SeriesCombining Time Series with Different FrequenciesInterpolating Missing ValuesRequesting Different Interpolation MethodsUsing the ID StatementSpecifying Observation CharacteristicsConverting Observation CharacteristicsCreating New VariablesTransforming Series
 -
Syntax
-
Details
-
Examples
- References
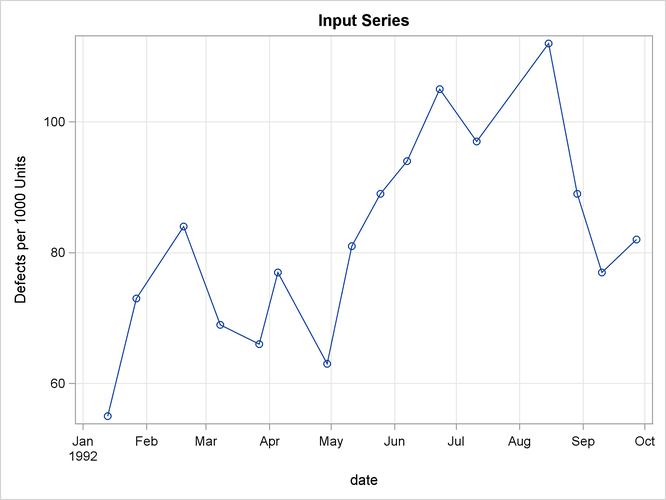
This example shows the interpolation of a series of values measured at irregular points in time. The data are hypothetical. Assume that a series of randomly timed quality control inspections are made and defect rates for a process are measured. The problem is to produce two reports: estimates of monthly average defect rates for the months within the period covered by the samples, and a plot of the interpolated defect rate curve over time.
The following statements read and print the input data, as shown in Output 15.3.1.
data samples;
  input date : date9. defects @@;
  label defects = "Defects per 1000 Units";
  format date date9.;
datalines;
13jan1992    55    27jan1992   73    19feb1992   84    8mar1992   69

   ... more lines ...
title "Sampled Defect Rates";
proc print data=samples;
run;
Output 15.3.1: Measured Defect Rates
| Sampled Defect Rates |
| Obs | date | defects |
|---|---|---|
| 1 | 13JAN1992 | 55 |
| 2 | 27JAN1992 | 73 |
| 3 | 19FEB1992 | 84 |
| 4 | 08MAR1992 | 69 |
| 5 | 27MAR1992 | 66 |
| 6 | 05APR1992 | 77 |
| 7 | 29APR1992 | 63 |
| 8 | 11MAY1992 | 81 |
| 9 | 25MAY1992 | 89 |
| 10 | 07JUN1992 | 94 |
| 11 | 23JUN1992 | 105 |
| 12 | 11JUL1992 | 97 |
| 13 | 15AUG1992 | 112 |
| 14 | 29AUG1992 | 89 |
| 15 | 10SEP1992 | 77 |
| 16 | 27SEP1992 | 82 |
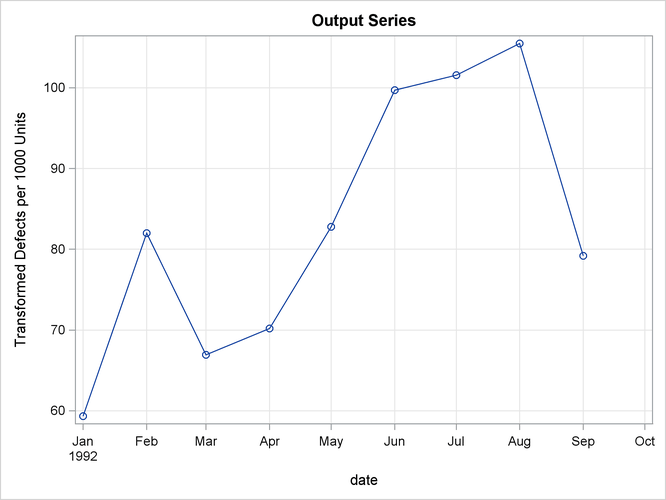
To compute the monthly estimates, use PROC EXPAND with the TO=MONTH option and specify OBSERVED=(BEGINNING,AVERAGE). The following statements interpolate the monthly estimates.
proc expand data=samples
            out=monthly
            to=month
            plots=(input output);
  id date;
  convert defects / observed=(beginning,average);
run;
The following PROC PRINT step prints the results, as shown in Output 15.3.2.
title "Estimated Monthly Average Defect Rates";
proc print data=monthly;
run;
Output 15.3.2: Monthly Average Estimates
| Estimated Monthly Average Defect Rates |
| Obs | date | defects |
|---|---|---|
| 1 | JAN1992 | 59.323 |
| 2 | FEB1992 | 82.000 |
| 3 | MAR1992 | 66.909 |
| 4 | APR1992 | 70.205 |
| 5 | MAY1992 | 82.762 |
| 6 | JUN1992 | 99.701 |
| 7 | JUL1992 | 101.564 |
| 8 | AUG1992 | 105.491 |
| 9 | SEP1992 | 79.206 |
The plots produced by PROC EXPAND are shown in Output 15.3.3.