The SYSLIN Procedure
- Overview
-
Getting Started
 An Example Model Variables in a System of Equations Using PROC SYSLIN OLS Estimation Two-Stage Least Squares Estimation LIML, K-Class, and MELO Estimation SUR, 3SLS, and FIML Estimation Computing Reduced Form Estimates Restricting Parameter Estimates Testing Parameters Saving Residuals and Predicted Values Plotting Residuals
 -
Syntax
-
Details
-
Examples
- References
| Plotting Residuals |
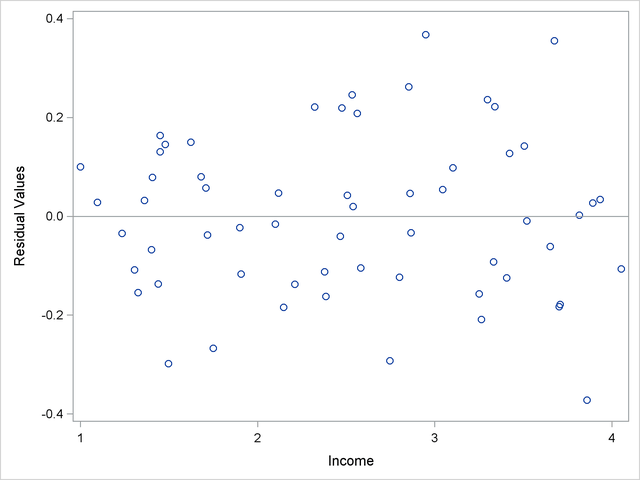
You can plot the residuals against the regressors by using the PROC SGPLOT. For example, the following statements plot the 2SLS residuals for the demand model against price, income, and price of substitutes.
proc syslin data=in 2sls out=out;
   endogenous  p;
   instruments y u s;
   demand: model q = p y s;
   output residual=residual_q;
run;

proc sgplot data=out;
   scatter x=p y=residual_q;
   refline 0 / axis=y;
run;

proc sgplot data=out;
   scatter x=y y=residual_q;
   refline 0 / axis=y;
run;

proc sgplot data=out;
   scatter x=s y=residual_q;
   refline 0 / axis=y;
run;
The plot for income is shown in Figure 29.12. The other plots are not shown.
Figure 29.12
Plot of Residuals against Income