The SPECTRA Procedure

Overview: SPECTRA Procedure
The SPECTRA procedure performs spectral and cross-spectral analysis of time series. You can use spectral analysis techniques to look for periodicities or cyclical patterns in data.
The SPECTRA procedure produces estimates of the spectral and cross-spectral densities of a multivariate time series. Estimates of the spectral and cross-spectral densities of a multivariate time series are produced using a finite Fourier transform to obtain periodograms and cross-periodograms. The periodogram ordinates are smoothed by a moving average to produce estimated spectral and cross-spectral densities. PROC SPECTRA can also test whether or not the data are white noise.
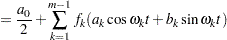
PROC SPECTRA uses the finite Fourier transform to decompose data series into a sum of sine and cosine waves of different amplitudes and wavelengths. The finite Fourier transform decomposition of the series  is
is
 |
 |
|||
 |
 |
where

is the time subscript,

are the equally spaced time series data

is the number of observations in the time series

is the number of frequencies in the Fourier decomposition:
 if is even,
  if is odd
is the frequency subscript,

is the mean term:


are the cosine coefficients

are the sine coefficients

are the Fourier frequencies:

Functions of the Fourier coefficients and can be plotted against frequency or against wave length to form periodograms. The amplitude periodogram  is defined as follows:
 |
Several definitions of the term periodogram are used in the spectral analysis literature. The following discussion refers to the sequence as the periodogram.
The periodogram can be interpreted as the contribution of the kth harmonic to the total sum of squares (in an analysis of variance sense) in the decomposition of the process into two-degree-of-freedom components for each of the m frequencies. When n is even,  is zero, and thus the last periodogram value is a one-degree-of-freedom component.
The periodogram is a volatile and inconsistent estimator of the spectrum. The spectral density estimate is produced by smoothing the periodogram. Smoothing reduces the variance of the estimator but introduces a bias. The weight function used for the smoothing process, W(), often called the kernel or spectral window, is specified with the WEIGHTS statement. It is related to another weight function, w(), the lag window, that is used in other methods to taper the correlogram rather than to smooth the periodogram. Many specific weighting functions have been suggested in the literature (Fuller 1976, Jenkins and Watts 1968, Priestly 1981). Table 26.3 later in this chapter gives the relevant formulas when the WEIGHTS statement is used.
Letting i represent the imaginary unit  , the cross-periodogram is defined as follows:
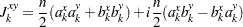 |
The cross-spectral density estimate is produced by smoothing the cross-periodogram in the same way as the periodograms are smoothed using the spectral window specified by the WEIGHTS statement.
The SPECTRA procedure creates an output SAS data set whose variables contain values of the periodograms, cross-periodograms, estimates of spectral densities, and estimates of cross-spectral densities. The form of the output data set is described in the section OUT= Data Set.