The FORECAST Procedure
- Overview
-
Getting Started
 Giving Dates to Forecast Values Computing Confidence Limits Form of the OUT= Data Set Plotting Forecasts Plotting Residuals Model Parameters and Goodness-of-Fit Statistics Controlling the Forecasting Method Introduction to Forecasting Methods Time Trend Models Time Series Methods Combining Time Trend with Autoregressive Models
 -
Syntax
-
Details
-
Examples
- References
Example 16.3 Forecasting Petroleum Sales
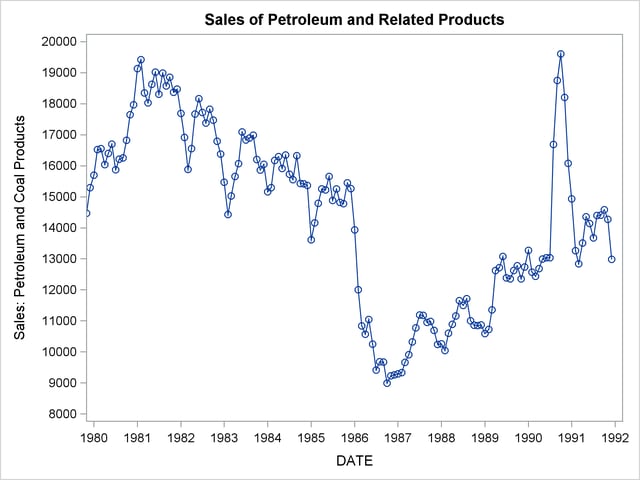
This example uses the double exponential smoothing method to forecast the monthly U. S. sales of petroleum and related products series (PETROL) from the data set SASHELP.USECON. These data are taken from Business Statistics, published by the U.S. Bureau of Economic Analysis.
The following statements plot the PETROL series:
title1 "Sales of Petroleum and Related Products";
proc sgplot data=sashelp.usecon;
   series x=date y=petrol / markers;
   xaxis values=('1jan80'd to '1jan92'd by year);
   yaxis values=(8000 to 20000 by 1000);
   format date year4.;
run;
The plot is shown in Output 16.3.1.
Output 16.3.1
Sales of Petroleum and Related Products
The following statements produce the forecast:
proc forecast data=sashelp.usecon interval=month
              method=expo trend=2 lead=12
              out=out outfull outest=est;
   id date;
   var petrol;
   where date >= '1jan80'd;
run;
The following statements print the OUTEST= data set:
title2 'OUTEST= Data Set: EXPO Method';
proc print data=est;
run;
The PROC PRINT listing of the output data set is shown in Output 16.3.2.
Output 16.3.2
The OUTEST= Data Set Produced by PROC FORECAST
| Sales of Petroleum and Related Products |
| OUTEST= Data Set: EXPO Method |
| Obs | _TYPE_ | DATE | PETROL |
|---|---|---|---|
| 1 | N | DEC91 | 144 |
| 2 | NRESID | DEC91 | 144 |
| 3 | DF | DEC91 | 142 |
| 4 | WEIGHT | DEC91 | 0.1055728 |
| 5 | S1 | DEC91 | 14165.259 |
| 6 | S2 | DEC91 | 13933.435 |
| 7 | SIGMA | DEC91 | 1281.0945 |
| 8 | CONSTANT | DEC91 | 14397.084 |
| 9 | LINEAR | DEC91 | 27.363164 |
| 10 | SST | DEC91 | 1.17001E9 |
| 11 | SSE | DEC91 | 233050838 |
| 12 | MSE | DEC91 | 1641203.1 |
| 13 | RMSE | DEC91 | 1281.0945 |
| 14 | MAPE | DEC91 | 6.5514467 |
| 15 | MPE | DEC91 | -0.147168 |
| 16 | MAE | DEC91 | 891.04243 |
| 17 | ME | DEC91 | 8.2148584 |
| 18 | RSQUARE | DEC91 | 0.8008122 |
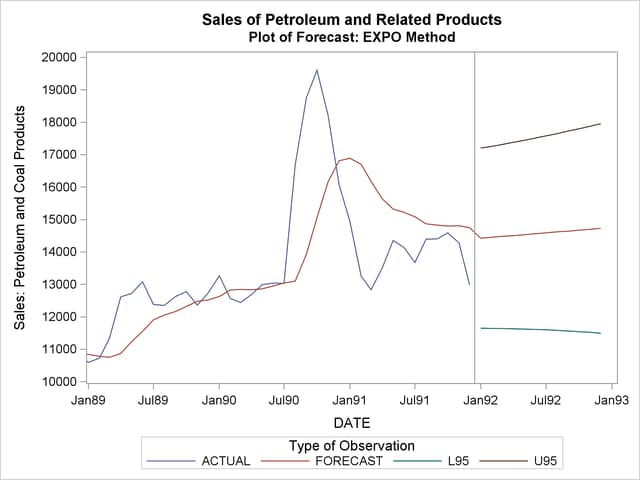
The plot of the forecast is shown in Output 16.3.3.
title1 "Sales of Petroleum and Related Products";
title2 'Plot of Forecast: EXPO Method';
proc sgplot data=out;
   series x=date y=petrol / group=_type_;
   xaxis values=('1jan89'd to '1jan93'd by qtr);
   yaxis values=(10000 to 20000 by 1000);
   refline '15dec91'd / axis=x;
run;
Output 16.3.3
Forecast of Petroleum and Related Products