| The TIMESERIES Procedure |
Example 29.4 Illustration of Spectral Analysis
This example illustrates the use of spectral analysis.
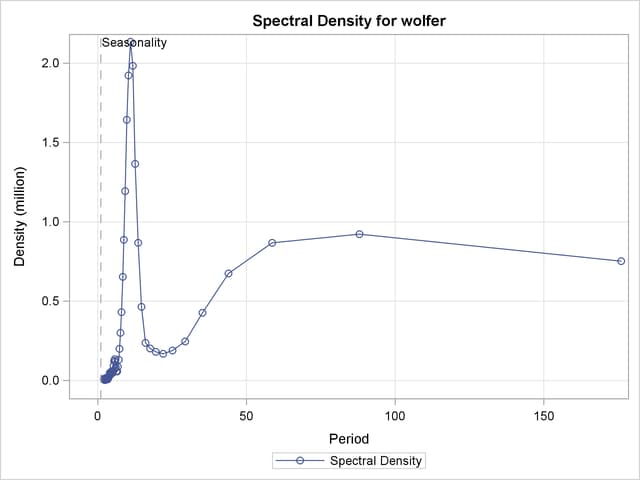
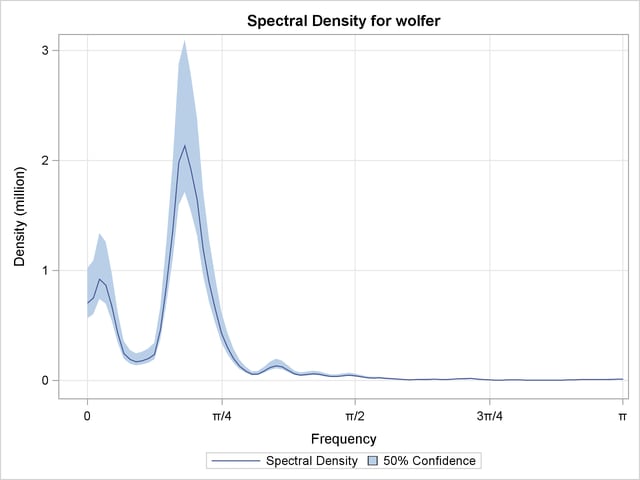
The following statements perform a spectral analysis on the SUNSPOT dataset. The periodogram and estimated spectral density are displayed as a function of the period in Output 29.4.1 and frequency in Output 29.4.2.
title "Wolfer's Sunspot Data";

proc timeseries data=sunspot plot=(series spectrum);
   var wolfer;
   id year interval=year;
   spectra freq period p s / adjmean bart c=1.5 expon=0.2;
run;
Output 29.4.1
Period Plot
Output 29.4.2
Frequency Plot
Copyright © SAS Institute, Inc. All Rights Reserved.