| Getting Started with Time Series Forecasting |
| Statistics of Fit Table |
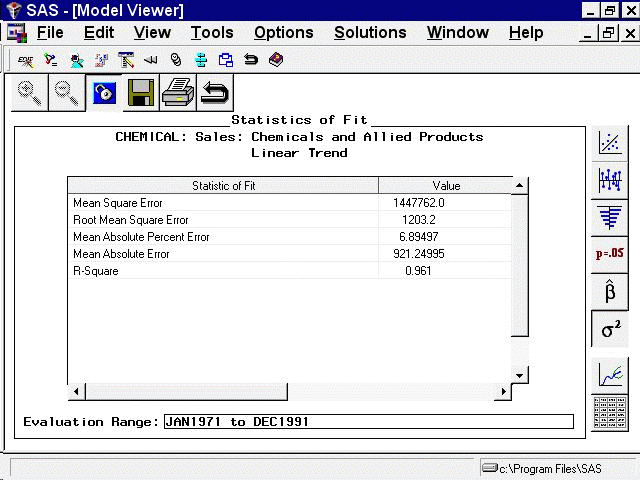
Select the sixth icon from the top in the vertical toolbar to the right of the table. This switches the Viewer to display a table of statistics of fit computed from the model prediction errors, as shown in Figure 39.45. The list of statistics displayed is controlled by selecting Statistics of Fit from the Options menu.
Figure 39.45
Model Viewer: Statistics of Fit Table
Copyright © SAS Institute, Inc. All Rights Reserved.