| The SYSLIN Procedure |
| Plotting Residuals |
You can plot the residuals against the regressors by using the PROC SGPLOT. For example, the following statements plot the 2SLS residuals for the demand model against price, income, and price of substitutes.
proc syslin data=in 2sls out=out;
   endogenous  p;
   instruments y u s;
   demand: model q = p y s;
   output residual=residual_q;
run;

proc sgplot data=out;
   scatter x=p y=residual_q;
   refline 0 / axis=y;
run;

proc sgplot data=out;
   scatter x=y y=residual_q;
   refline 0 / axis=y;
run;

proc sgplot data=out;
   scatter x=s y=residual_q;
   refline 0 / axis=y;
run;
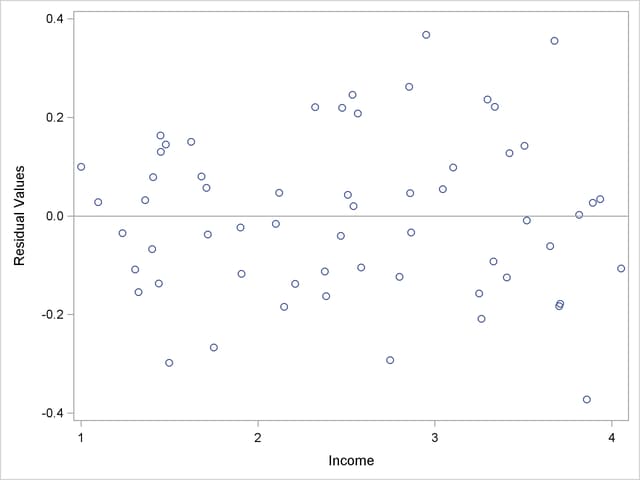
The plot for income is shown in Figure 27.12. The other plots are not shown.
Figure 27.12
Plot of Residuals against Income
Copyright © SAS Institute, Inc. All Rights Reserved.