| The PANEL Procedure |
| ODS Graphics Plots |
ODS graphics plots can be obtained to graphically analyze the results. The following statements show how to generate the plots. If the PLOTS=ALL option is specified, all available plots are produced in two panels. For a complete list of options, see the section ODS Graphics.
proc panel data=airline;
   id i t;
   model lC = lQ lPF LF / fixtwo plots = all;
run;
The preceding statements result in plots shown in Output 19.2.5 and Output 19.2.6.
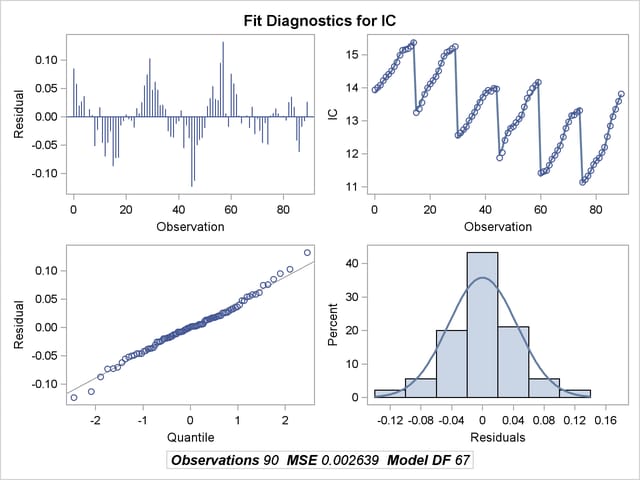
Output 19.2.5
Diagnostic Panel 1
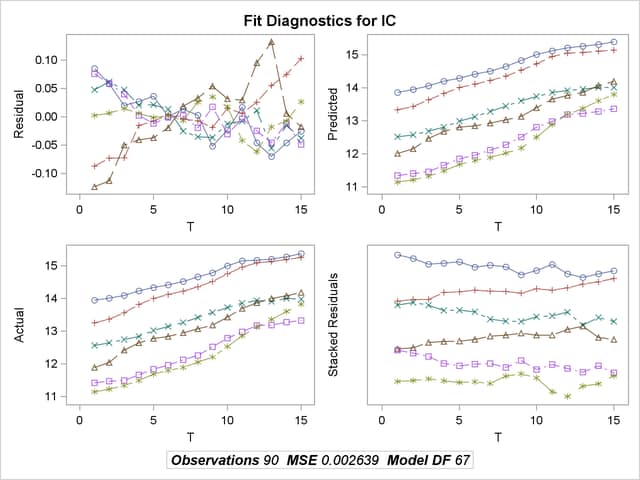
Output 19.2.6
Diagnostic Panel 2
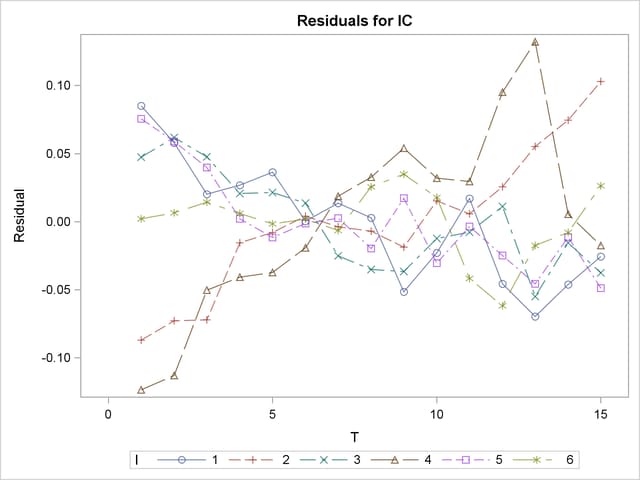
The UNPACK and ONLY options produce individual detail images of paneled plots. The graph shown in Output 19.2.7 shows a detail plot of residuals by cross section. The packed version always puts all cross sections on one plot while the unpacked one shows the cross sections in groups of ten to avoid loss of detail.
proc panel data=airline;
   id i t;
   model lC = lQ lPF LF / fixtwo plots(unpack only) = residsurface;
run;
Output 19.2.7
Surface Plot of the Residual
Copyright © SAS Institute, Inc. All Rights Reserved.