| The ENTROPY Procedure |
Example 12.5 Illustration of ODS Graphics
This example illustrates how to use ODS graphics in the ENTROPY procedure. This example is a continuation of the example in the section Simple Regression Analysis. Graphical displays are requested by specifying the ODS GRAPHICS statement. For information about the graphics available in the ENTROPY procedure, see the section ODS Graphics.
The following statements show how to generate ODS graphics plots with the ENTROPY procedure. The plots are displayed in Output 12.5.1.
   proc entropy data=coleman;
      model test_score = teach_sal prcnt_prof socio_stat
                         teach_score mom_ed;
   run;
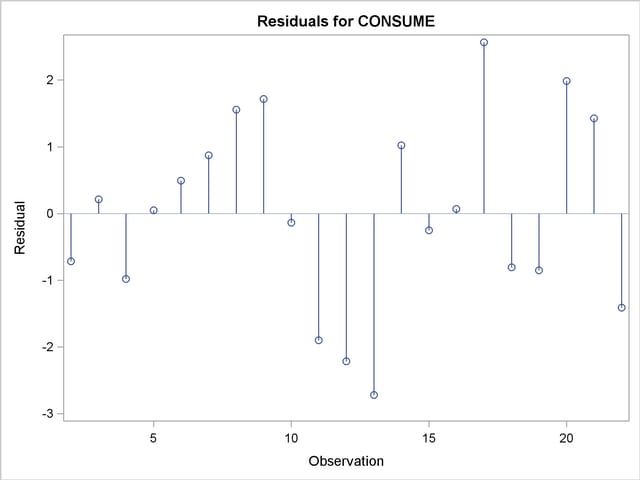
Output 12.5.1
Model Diagnostics Plots
Note: This procedure is experimental.
Copyright © 2008 by SAS Institute Inc., Cary, NC, USA. All rights reserved.