Saved Profile Reports
Introduction
Use the Saved Profile Reports directive
to view the results of previously executed data profiles and to create
notes about the results. The profiles are created with the Profile
Data directive. The profile reports and notes are stored as XML documents
on the file system. Saved Profile Reports displays these XML files
in a readable format.
About Profile Reports
Profile reports can provide valuable information about
a Hadoop table and help identify issues that might exist before you
use the table for data management or analysis. A profile report includes
a summary view with information about the table that was profiled
and detail views with information about individual columns in the
table.
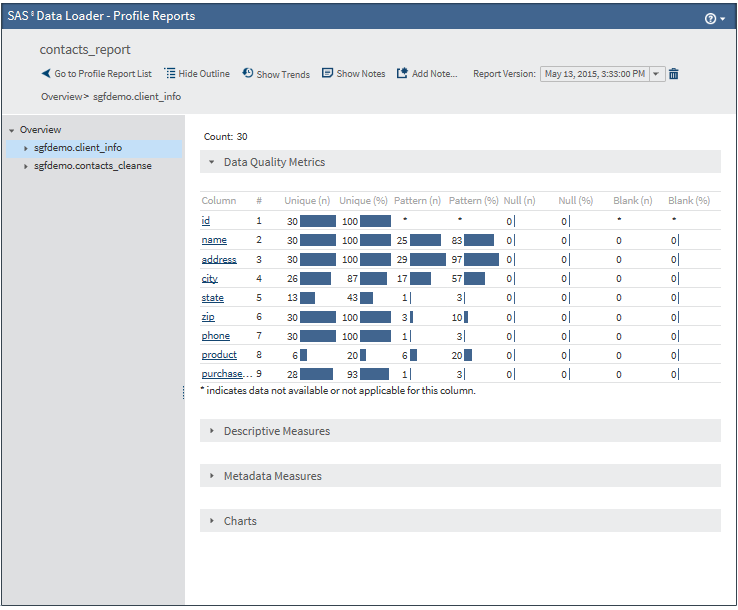
Summary View
The summary view of
a profile report includes the following information:
Count
the total number of
rows in the table that was profiled.
Data Quality Metrics
measurements of data
quality for the columns in the table. Measurements include information
about the uniqueness of column values, pattern analysis results, and
completeness information, including null or blank values.
Note: The measurement of percent
null (Null (%)) is rounded to the nearest
tenth of a percent. Percentages of null values that are smaller than
0.01 are rounded to zero. Refer to the number of null values (Null
(n)) as needed.
Descriptive Measures
descriptive statistics
for columns in the table, including information about the central
tendency of the data and how it is dispersed. Depending on the data
type of the column, these measures might not be available.
Metadata Measures
metadata for the columns
in the table, including the data type, the column length, and whether
the column is a primary key candidate.
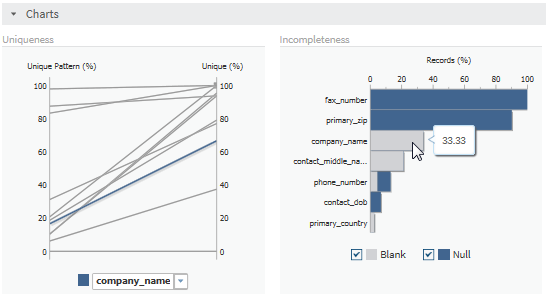
Charts
summary graphics that
provide information about the uniqueness and incompleteness of column
values.
Column Detail Views
When you click on a
column from the summary view in a profile report, another view is
displayed that provides more detailed information about the selected
column.
The detail view of
a profile report includes the following information:
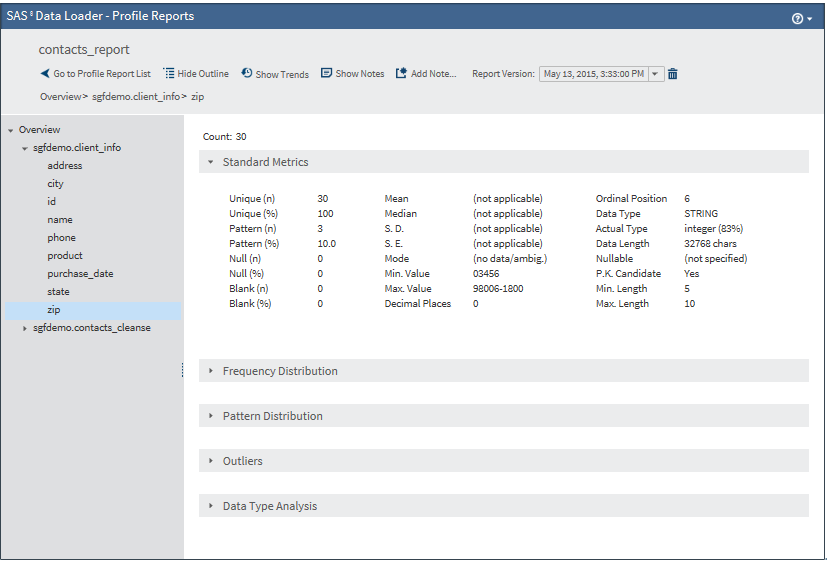
Count
the total number of
rows in the table that was profiled.
Standard Metrics
a combined listing
of the data quality metrics, the descriptive measures, and the metadata
measures for the column that were displayed on the summary view.
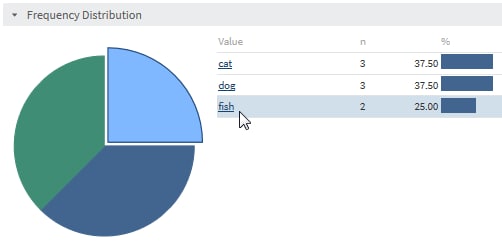
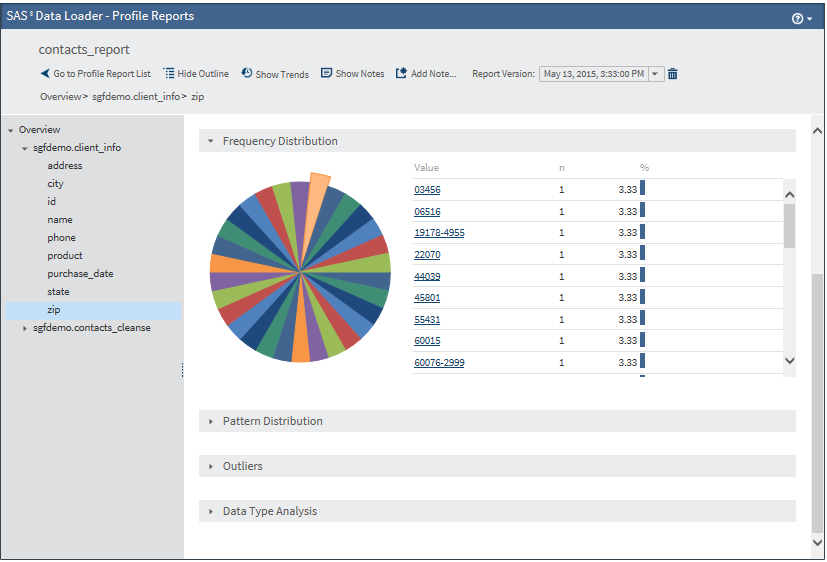
Frequency Distribution
a listing of the unique
values for the column, including information about how frequently
a value occurs in the table. When you select a value from the list,
the associated section of the pie chart is highlighted.
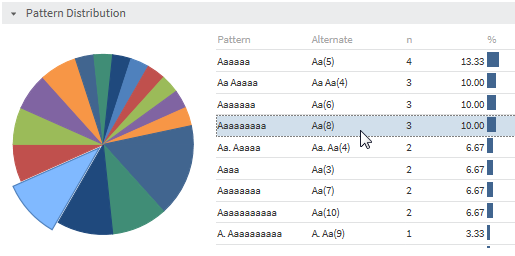
Pattern Distribution
a listing of the distinct
pattern values that were derived from performing pattern analysis
on the values for the column. The content of the pattern value describes
the content of the data and indicates whether each character is uppercase,
lowercase, or numeric. When you select a value from the list, the
associated section of the pie chart is highlighted.
Outliers
a listing of extreme
values for the column. By default, the 10 lowest values and the 10
highest values are saved, but you can change the number of outliers
that are saved in the profile configuration settings. For more information,
see Profiles Panel.
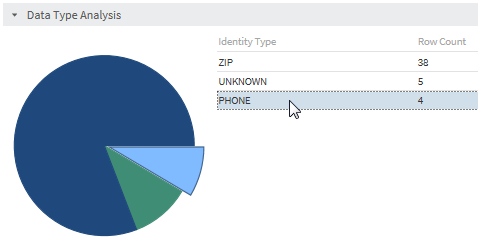
Data Type Analysis
a listing of possible
types of data for the information in the column, as determined by
data type analysis that is automatically performed by SAS Data Loader.
Results for data type analysis are available only for columns that
contain string characters (for example, contact information such as
name, address, state, ZIP code, and so on).
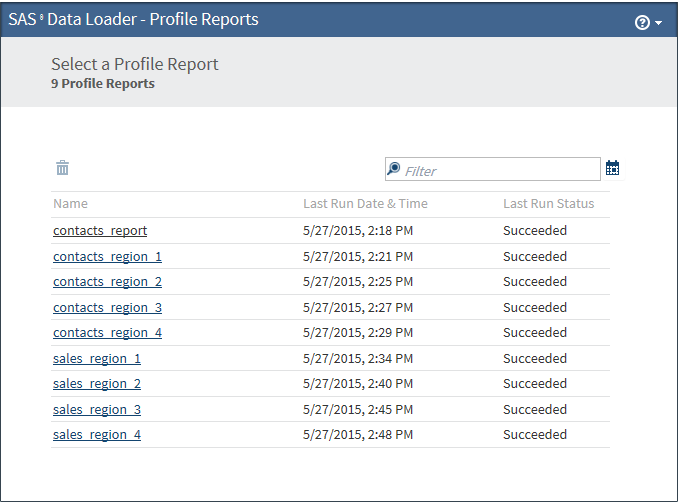
Open Saved Profile Reports
To open a saved profile
report:
-
To open a profile report, click its name.
-
If the report contains a single table, the table opens directly in the detail view shown inStep 6.
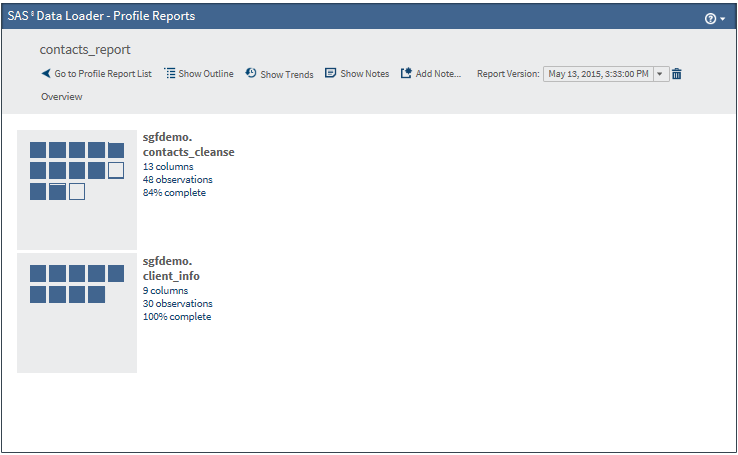
-
-
You can click a table to go directly to a more detailed view or you can click
 to open the outline view:
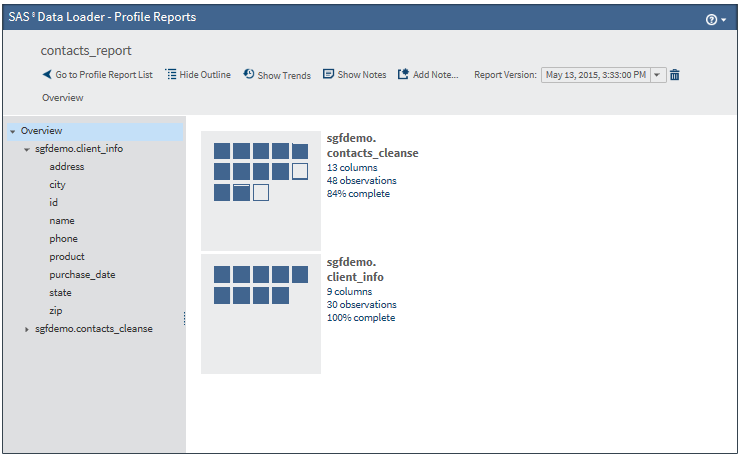
The following actions are available:Go to Profile Report Listreturns you to the Profile Report List.Show or Hide Outlinedisplays or hides the outline in the left pane.Show or Hide Trendsdisplays or hides the trend graphs for data that is presented in the summary view. You can use trend graphs to quickly visualize changes in the data across multiple versions of the same report. When trend graphs are not displayed, the current value of the metric is shown. For example:
to open the outline view:
The following actions are available:Go to Profile Report Listreturns you to the Profile Report List.Show or Hide Outlinedisplays or hides the outline in the left pane.Show or Hide Trendsdisplays or hides the trend graphs for data that is presented in the summary view. You can use trend graphs to quickly visualize changes in the data across multiple versions of the same report. When trend graphs are not displayed, the current value of the metric is shown. For example: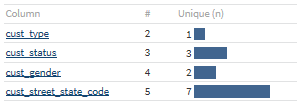 When trend graphs are on, each graph displays the 10 most recent values of a metric, as determined by the selected version of the report. For example:
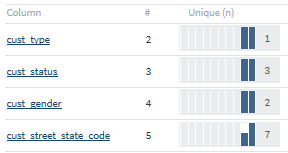 To view the complete list of values for the metric, you can click the trend graph. A window is displayed:
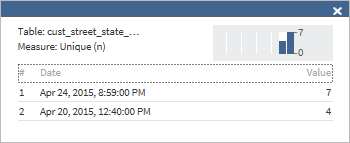 Show or Hide Notesdisplays or hides notes in the right pane. You can filter the notes by entering a text string into the filter field.Add Noteopens a dialog box in which you can add a note.Report Versionenables you to select the version of the report by date.


Copyright © SAS Institute Inc. All rights reserved.