| SAS/IntrNet 9.2: Application Dispatcher |
Debugging in the Input Component
The special variable _DEBUG provides you with several diagnostic options. Using this variable is a convenient way to debug a problem, because you can supply the debug values by using the Web browser to modify your HTML or by editing the URL in your Web browser location field.
- List of Valid Debug Values
- Disabling Debug Flags
- Special Cases
- Debugging Application Broker Installation Problems
List of Valid Debug Values
You can activate the various debugging options by passing the _DEBUG variable to the Application Broker just as you pass the special variables _SERVICE and _PROGRAM. You can set more than one debug option by adding the flag values together. For example, to set both the options 2048 and 2, use the value (2048 + 2) = 2050.
Keywords can also be used to set debug options. To set these same options using the keywords, you would specify
_DEBUG=TIME,TRACE
Multiple parameters (values or keywords) can be specified separated by commas or spaces. These values are then logically put together to form one debug number.
Some debug flags might be locked out at your site in the Application Broker configuration file for security reasons. Verify with your administrator which flags are locked out at your site. See Setting the Default Value of _DEBUG for more information on setting the debug value. The following chart is a list of valid debug values:
| Value | Keyword | Description |
|---|---|---|
| 1 | FIELDS | Echoes all fields. This is useful for debugging value-splitting problems. |
| 2 | TIME | Prints the Application Broker version number and elapsed time after each run, for example, "This request took 2.46 seconds of real time (v9.2 build 1494)." Also, this value displays the Powered by SAS logo if you provide additional settings as described in Displaying the Powered by SAS Logo. |
| 4 | SERVICES | Lists definitions of all services as defined by the administrator, but does not run the program. |
| 8 | Skips all execution processing. | |
| 16 | DUMP | Displays output in hexadecimal. This is extremely helpful for debugging problems with the HTTP header or graphics. |
| 32 | Displays the Powered by SAS logo without the Application Broker version or elapsed time information. See also Displaying the SAS Powered Logo. | |
| 128 | LOG | Returns log file. This is useful for diagnosing problems in the SAS code. |
| 256 | Is not used in SAS 9 or later. Previous version socket debug data incorporated into debug 2048. | |
| 512 | Shows socket host and port number in status message (by default off for security reasons). | |
| 1024 | ECHO | Echoes data usually sent from the Application Broker to the Application Server. It does not run the program. In the case of a launch service, this also shows the SAS command that would have been invoked by the Application Broker. |
| 2048 | TRACE | Traces socket connection attempts. This is helpful for diagnosing the machine communication process. |
| 4096 | Prevents the deletion of temporary files that are created for launch. This is useful for debugging configuration problems in a launch service (before Version 8). | |
| 8192 | Returns entire SAS log file from a launched service (before Version 8). | |
| 16384 | ENV | Displays a selection of the Application Broker environment parameters. |
Disabling Debug Flags
In the Application Broker configuration file, you can specify the debug values that you are and are not allowed to set. The DebugMask and ServiceDebugMask directives control this. The information below describes the DebugMask directive but it also applies to the ServiceDebugMask directive.
The default value for the DebugMask is 32767. This is adequate for most sites. The value 32767 indicates that all debug values are allowed. This means that commenting out the DebugMask directive is the same as allowing all debug values.
Note: Some debug values might pose a security risk. To avoid potential security risks, selectively disable them by specifying a DebugMask value that is the sum of the values that you want to allow. The safest approach is to set DebugMask to 0, 2, 32, or 34 (sum of 2 and 32). These values do not pose a security risk.
Below is an illustration of how the Application Broker uses DebugMask to restrict certain values. The value 32767 is the sum of all the allowed debug values (1 through 16384). The following chart shows all the bits enabled for the DebugMask=32767 value (in binary notation):
| 16384 | 8192 | 4096 | 2048 | 1024 | 512 | 256 | 128 | 64 | 32 | 16 | 8 | 4 | 2 | 1 |
| 1 | 1 | 1 | 1 | 1 | 1 | 1 | 1 | 1 | 1 | 1 | 1 | 1 | 1 | 1 |
If you want to prevent the use of debug value 2048, disable the DebugMask bit for 2048, as shown next:
| 16384 | 8192 | 4096 | 2048 | 1024 | 512 | 256 | 128 | 64 | 32 | 16 | 8 | 4 | 2 | 1 |
| 1 | 1 | 1 | 0 | 1 | 1 | 1 | 1 | 1 | 1 | 1 | 1 | 1 | 1 | 1 |
To allow all debug values except 2048, specify a DebugMask value of 30719 (which is 32767 - 2048).
To allow only debug values of 2 and 2048, specify a DebugMask value of 2050 (which is 2 + 2048).
Note: The last technique is safer because additional debug values exist that are not documented. But if you do enable them, these debug values could pose a security risk.
The Application Broker displays an error if the binary values for _DEBUG and DebugMask do not equal 0 using binary logic. The Application Broker performs error checking only on the _DEBUG value in the HTML form or link. It does not check to confirm that Debug and DebugMask do not overlap. In other words, it does not check Debug to see whether it has an allowed value in DebugMask. DebugMask is used to check values of _DEBUG only.
Special Cases
Some combinations of content types and debug values do not produce the expected results. The debug values 2, 32, 128, and 8192 do not function correctly if the content type is anything other than TEXT or HTML. For example, if your program sends a content type of IMAGE or GIF, then the Web browser expects the data that follows to be binary graphic data. If you supply one of these debug values, then the Application Broker tries to append HTML code to the end of the binary graphic data. This HTML is not displayed in the Web browser; only the image is displayed. One way to work around this is to supply the debug value 1 in addition to the value(s) above. This causes the Application Broker to send the content type TEXT or HTML before your program can send the IMAGE or GIF content type. Because the Web browser sees the TEXT or HTML content type first, it displays the debug output that you have requested. However, because the binary graphic data is combined with HTML data, garbage characters will take the place of the expected image on the Web page.
Keep in mind that setting the debug variable to 1 or 128 generates an HTTP header. This will affect the behavior of a test that changes the HTTP header in any way.
Some HTML formatter macros create their own headers. For example, if you are using SETCOOKIE on a header, the cookies do not work when DEBUG=1 or DEBUG=128 is set.
Debugging Application Broker Installation Problems
To verify that the Application Broker can be executed, run the image from a command line on the Web server machine:
broker "_service=default&_program=ping"
If the broker.cfg file is set up correctly and there is an Application Server running for service "default", the results will be similar to
   Content-type: text/html
   Pragma: no-cache

   Ping. The Application Server your.server.com:5800 is
   functioning properly.

   -------------------------------------------------------------

   This request took 0.28 seconds of real time (v9.2 build nnnn).
Because CGI programs typically run as special nonprivileged users, it is sometimes useful to perform this test with a guest account. On z/OS machines there are occasional problems with the installation of the SAS/C transient library that will be revealed by performing this test.
- From a Web browser on the client machine, try to access the Application Broker image via a URL of the form
http://yourserver/cgi-bin/broker.exe?
The Application Broker program in the URL will be the correct image to use for the Web server machine. If the Web browser tries to download the program as a file, then you have discovered the problem: the Web server is not configured correctly to execute CGI programs. For UNIX Web servers, typically you must add a line to the Web server HTTP config file for the CGI directory.
When this command works correctly, the Web browser displays the following welcome page, which contains a link to an administration page:
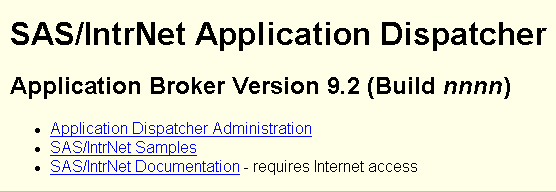
Note: If there is a customized Application Broker welcome page, then it will display instead of this default welcome page when you enter the Application Broker URL in your Web browser. If this is the case, and if you want to view the services that are available from the default welcome page, then add _DEBUG=4 to the URL, as follows:
http://yourserver/cgi-bin/broker.exe?_debug=4
To test the Applications Server from the Web browser, enter a URL of the form
http://yourserver/cgi-bin/broker.exe?_service=default&_program=ping
If the broker.cfg file is set up correctly and there is an Application Server running for service "default", the results will look like this:
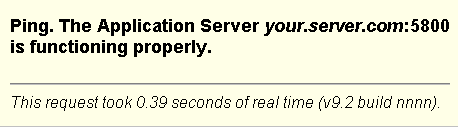
If this test fails but the test in the first step succeeds, there is usually a permission problem with the CGI running from the Web server. CGI programs are typically started under a nonprivileged account that might not have access to required system resources. Try totally disabling anonymous access for the CGI directory in the Web server. This forces the Application Broker to run with an authenticated user name. On Windows systems, check the permissions on the entire \winnt\system32 directory tree and verify that the user account IUSR_nodename has the user rights "Access this computer from network" and "Log on locally."
For pool service problems, verify that the Load Manager is running and a log is being created. When a pool service request is initiated, the actual command that starts the Application Server is written to the log. It is often useful to copy this command from the log and issue it on a command line to verify that the server starts. If the SAS Spawner is not being used, the Applications Server runs under the user name that started the Load Manager with the corresponding privileges and permissions. Occasionally the work directory does not get set correctly and you must add a "-work /tmp" parameter to the SAS command.
If the server starts but the Application Broker times out, verify that there are not multiple TCP/IP node names defined for a given host. The Application Broker and Load Manager hosts must resolve all node names to the same value. Host name mismatches can cause various error messages to appear in the Load Manager log.
To debug problems with launch and pool services, it is useful to obtain the SAS log and investigate any errors concerning the SasCommand that was executed.
To see the SasCommand that is being processed, add the parameter _DEBUG=1024 to the URL that is being used to start the service. This shows any errors with quotes or non-escaped backslashes.
Under UNIX, using the following syntax puts the SAS log, STDOUT, and STDERR messages into files using the Application Broker PID for the filenames:
   SasCommand "/bin/ksh -c '/usr/local/bin/sas  +
      /user/web/launchsas.sas -rsasuser -noterminal -noprint +
      -log $$.log  -SYSPARM $$.out 2>$$.err'"
Note: The user name that the Application Broker runs under must be able to write to the directory where the Application Broker runs.
Copyright © 2007 by SAS Institute Inc., Cary, NC, USA. All rights reserved.