Depending
on how the report creator designed the report, View mode might contain
the following items:
-
-
-
-
one or more geographical maps
-
-
one or more stored processes
-
-
-
a table of contents (for reports
with separate pages for group breaks)
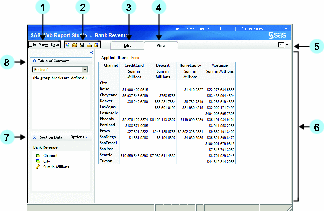
The View Mode Interface is an example of a report displayed in View mode. The report contains query results from a multidimensional
data source. The main features of this specific report and the
View tab are identified.
-
Select
the
File,
View,
or
Data menu items to access options that
apply to the entire report or the currently displayed report section,
including the objects in the section.
-
Use these
icons to create a new report, open an existing report, save the current
report, print the current report, or export the current report.
-
Authorized
users can click the
Edit tab to open the
viewed report in Edit mode.
-
The
View tab is on top when View mode is active.
-
This
navigational box indicates the section that you are editing, as well
as the total number of sections in the report. To view a different
section, either enter a number in the box or select
View Section
 and select the section that you want to open.
-
The body
contains the report or stored process.
-
Use the
Section Data panel to select data and to view an indicator
of whether objects are independent or synchronized. This panel can
be collapsed horizontally or vertically.
-
Use the
Table of Contents panel to work with both sections and
group breaks. Use the
Options menu in Edit
mode to switch between sections and navigate between group breaks.
This panel can be collapsed horizontally or vertically.
In View
mode, you can drag a data item from the
Section Data pane and drop it on tables and graphs.
Note: Some reports
and stored processes require that you answer prompts before their
output is rendered.
