Managing Totals and Subtotals in Tables

About Totals and Subtotals
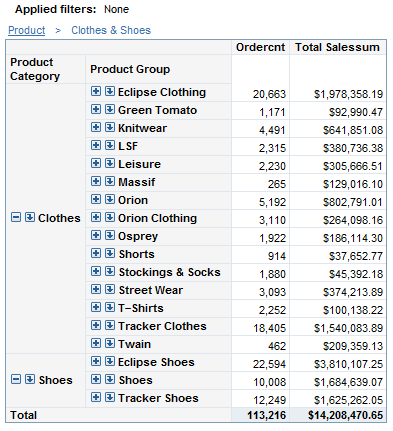
Totals can be positioned at the top, at the bottom, on the left, or on the right of a table element (for multidimensional data sources). By default, total and subtotal values are displayed in boldface type. In addition, their table cells have a light blue background. For more information about how to change the properties for displaying totals, see Specify Style Properties for Total and Subtotal Values.
Multidimensional Crosstabulation Table with Formatted Column Total Values
Crosstabulation Table with Formatted Row Totals and Column Subtotals

Show or Hide Totals and Subtotals for List Tables

To show or hide totals for list tables, complete these steps:
  1. Right-click on the list table, and then select Total to open the Total dialog box.
  2. Select or deselect the Totals check box.
  3. Click OK.

Show or Hide Totals and Subtotals for Crosstabulation Tables

To show or hide totals for crosstabulation tables, complete these steps:
  1. Right-click on the crosstabulation table, and then select Total to open the Total dialog box.
  2. Select one or more of these options:
    Row totals
    Select this option to display row totals.
    Row subtotals
    Select this option to display row subtotals.
    Column totals
    Select this option to display column totals.
    Column subtotals
    Select this option to display column subtotals.
  3. Click OK.

Show or Hide Totals and Subtotals for Multidimensional Tables

For multidimensional data, in addition to the choices listed above for crosstabulation tables, the Totals dialog box provides some additional options:
Display
You can choose where totals and subtotals appear. You can select either On top (left) or On bottom (right).
Type
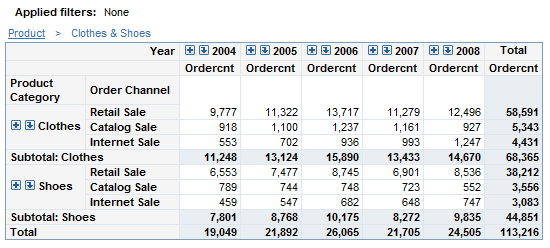
You can choose whether totals and subtotals are based on all data or only the data that is being displayed. You can select either Visual totals (for totals and subtotals that are based on just the values being shown in your table) or Parent totals (for totals and subtotals that include all data in the cube, not just what’s shown in your table). For example, if your table contains a filter so that it shows data from only 2008 but your cube contains data for 2006-2009, then Visual totals provides a total for just 2008 values, while Parent totals provides a total that includes data from all four years.
Itemize Values Across Hierarchies
If you specify any totals or subtotals, you see an itemize values across hierarchies check box. If you select this check box and if you have more than one category on rows or columns, then in addition to grand totals, your table contains additional subtotal values for the outer categories.