Using SAS Management Console to Monitor SAS Servers
About SAS Management Console's Server Management Features
You can use SAS Management
Console to monitor the activity of SAS servers, including the metadata
server, object spawners, OLAP servers, pooled workspace servers, stored
process servers, framework data servers, and workspace servers. You
can view the following types of information:
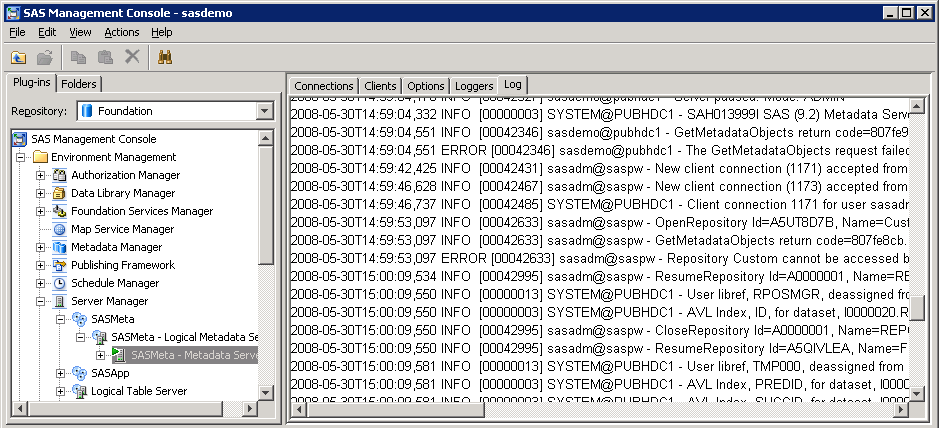
This information is displayed on tabs in SAS Management
Console, as shown in the following example:
Obtain the Appropriate User Credentials, and Clear Cached Credentials (If Necessary)
To
perform server monitoring in SAS Management Console, you must have
the appropriate user credentials. To determine what credentials are
required for each group of tasks, see Who Can Do What in the Server Manager Plug-in.
If you attempt to connect
to a server or spawner and you are denied access, make sure you have
the appropriate credentials. After your credentials are updated, be
sure to clear the credentials cache before you try to connect again.
To clear the credentials cache, click File Clear Credentials Cache in
SAS Management Console.
Clear Credentials Cache in
SAS Management Console.
Use SAS Management Console to Connect to Servers and Display Server Monitoring Information
-
Log on to SAS Management Console as a user with the appropriate credentials. See Who Can Do What in the Server Manager Plug-in.
-
To connect to the metadata server, an OLAP server, or a framework data server and display monitoring information:
-
The following server monitoring tabs become active: Clients, Options, Loggers, and Log. For OLAP servers and framework data servers, a Sessions tab also appears.Note: If some tabs are disabled, then you need additional user credentials. See Who Can Do What in the Server Manager Plug-in.To use the information on the tabs, see Use the Server Manager Tabs to Obtain Monitoring Information and to Adjust Logging Levels (If Needed).
-
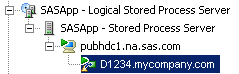
To connect to a workspace server, pooled workspace server, or stored process server and display monitoring information, follow these steps:
-
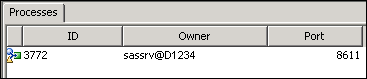
In the Server Manager tree, highlight the process that you want to monitor, as shown in this example:The following server monitoring tabs become active: Clients, Options, and Loggers. For stored process servers, the Sessions and Log tabs also become active.Note: If some tabs are disabled, then you need additional user credentials. See Who Can Do What in the Server Manager Plug-in.To use the information on the tabs, see Use the Server Manager Tabs to Obtain Monitoring Information and to Adjust Logging Levels (If Needed).
-
To connect to an instance of the object spawner and display monitoring information, follow these steps:
-
The following server monitoring tabs become active: Clients, Spawned Server Activity, Options, Loggers, and Log.Note: If some tabs are disabled, then you need additional user credentials. See Who Can Do What in the Server Manager Plug-in.To use the information on the tabs, see Use the Server Manager Tabs to Obtain Monitoring Information and to Adjust Logging Levels (If Needed).
Use the Server Manager Tabs to Obtain Monitoring Information and to Adjust Logging Levels (If Needed)
About the Server Manager Tabs
After you have set the
Server Manager options and connected to a server or a spawner, as
described in the preceding topics, SAS Management Console displays
server monitoring information in the right pane in a series of tabs.
Depending on which server
component you are monitoring, SAS Management Console might display
the following tabs:
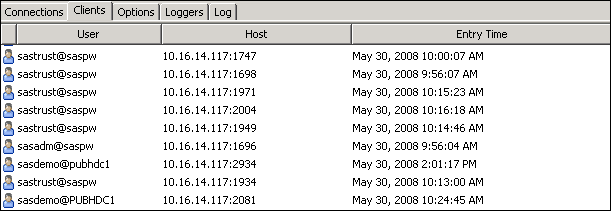
Use the Clients Tab in the Server Manager
Use the Sessions Tab in the Server Manager
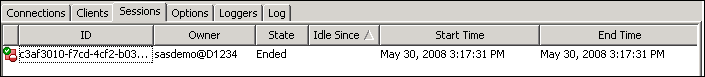
The Sessions tab in the Server
Manager lists the sessions that are active on the currently selected
server or server process. Depending on your options settings, inactive
and terminated sessions might also be displayed, as shown in this
example:
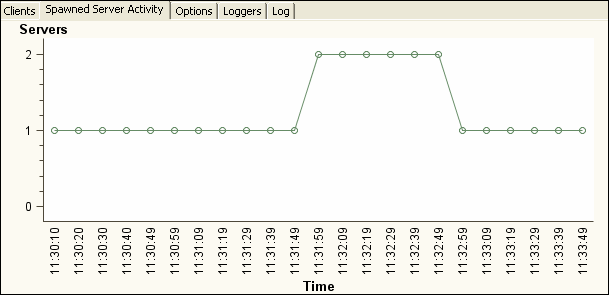
Use the Spawned Server Activity Tab in the Server Manager
The Spawned Server Activity tab
in the Server Manager displays a graph that shows server activity
associated with the currently selected object spawner connection.
The graph shows how many spawned workspace servers, pooled workspace
servers, and stored process servers are active at a given point in
time, as shown in the following example:
Use the Options Tab in the Server Manager
The Options tab displays performance
counters and other information fields for the currently selected server
or spawner session, as shown in the following example:
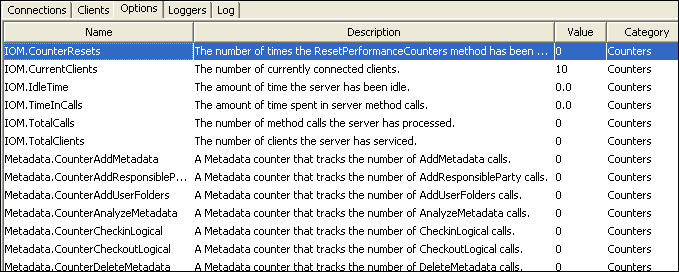
For more information
about the performance counters and information fields, see Using the Server Performance Counters and Information Fields.
Some types of properties
(for example, the JNLLINEMAX and JNLSTRMAX object server parameters)
can be modified in this tab. To change the value of a property, right-click
the property entry and click Edit. The changes
remain in effect until the server component or process stops. When
the server component is restarted, the options revert to those that
are defined in the server's configuration file.
Use the Loggers Tab in the Server Manager, and (If Necessary) Change Logging Levels for Individual Loggers
The Loggers tab
in the Server Manager displays the loggers that are in use for the
selected server component, as shown in the following example:
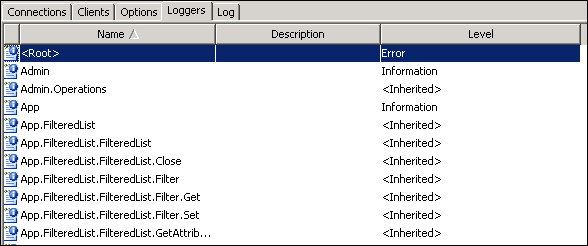
For each logger that
is associated with the server component, this tab shows the logging
level that is in effect. If <Inherited> appears
in the third column, then the logging level is not set explicitly
for the logger. Instead, the level is inherited from a parent logger.
If you want to see which logging level is in effect through inheritance,
then right-click the entry and select Properties.
The logging levels that
are in effect at server start-up are based on the server's logging
configuration file. In most cases, there is no need to change the
logging levels. However, SAS Technical Support might request that
you change a logging level temporarily to assist in problem resolution.
For example, you might be requested to increase the level for the
object spawner's
App logger.
CAUTION:
Excessive
logging can degrade performance. You should not use the TRACE and
DEBUG logging levels unless you are directed to do so by SAS Technical
Support.
Note: The logging levels that are
set in the default configuration files should be sufficient for most
sites. If you need to permanently change logging levels for a component,
then you must change the logging configuration file. To maintain system
performance, use extreme caution in making these changes.
The Loggers tab
is displayed for the following server components:
For more information, see Administering Logging for SAS Servers in this guide, as well as the SAS Logging: Configuration and Programming Reference.
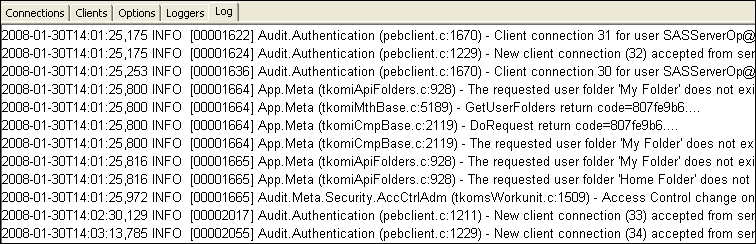
Use the Log Tab in the Server Manager
The Log tab displays log events
for the currently selected server or server process, as shown in the
following example:
-
Use the Server Manager options to specify a message level or threshold level filter. You can also specify a starting and ending time.Note: These settings filter the events that are already being generated based on the server's logging configuration file and the Loggers tab; they do not generate additional events. If you want to generate additional events, use the Loggers tab to change the level for one or more loggers, or modify the server's logging configuration file.

The events that are
displayed in this tab depend on the following:
For example, if you specify a threshold level of
TRACE in the Server Manager Options, but none of the loggers are set
to TRACE in the logging configuration file or on the Loggers tab,
then no TRACE events will appear in SAS Management Console. You must
first adjust the logging level for the appropriate loggers either
in the logging configuration file or the Loggers tab.
-
adjustments to logging levels that you might have made on the Loggers tab. These adjustments override the logging configuration file and remain in effect for the duration of the server session.
CAUTION:
Excessive
logging can degrade performance. Therefore, you should not use the
TRACE and DEBUG logging levels unless you are directed to do so by
SAS Technical Support.
The Log tab
is displayed for the following server components:
For more information, see Administering Logging for SAS Servers in this guide, as well as the SAS Logging: Configuration and Programming Reference.
Return Logging to Normal Levels, Disconnect from the Servers, and Stop Displaying Log Messages
-
If you changed the logging levels using the Loggers tab, then manually reset the loggers to their normal levels.