| Table Analysis |
Exact Test
You may have noticed that the preceding statistical output also included a test called Fisher's Exact test. When the sample size for the test of association of a table does not meet the usual guidelines (generally 20-25 total observations for a 2 × 2 table, with 80 percent of the table cells having counts greater than 5), an exact test may be a useful strategy.
The following data illustrate where an exact test may be appropriate. A marketing research firm took a sample of members at a health club and asked them a series of questions. They were interested in gathering information that could help their clients decide on audiences to target for new magazines. One of the questions was what activity the member considered his or her primary activity at the club. Another question was whether the member was considering making a major diet change. The researchers were interested in what types of sports magazines in which to place ads for a new food and nutrition magazine.
Open the Gym Data Set
These data are provided as the Gym data set in the Analyst Sample Library. To open the Gym data set, follow these steps:- Select Tools
 Sample Data ...
 - Select Gym.
- Click OK to create the sample data set in your Sasuser directory.
- Select File
 Open By SAS Name ...
 - Select Sasuser from the list of Libraries.
- Select Gym from the list of members.
- Click OK to bring the Gym data set into the data table.
Figure 9.9 displays the data table containing these data. Note that the data are in frequency form, with the variable count containing the frequencies of the profile contained in each row of the table. The variable activity contains the type of activity, which can be aerobics, yoga, weightlifting, team sports such as volleyball and basketball leagues, and cross-training. The variable DietChange indicates whether the member was contemplating a change in diet.
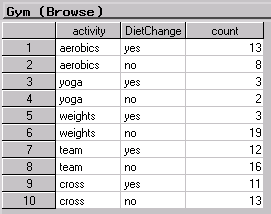 |
Figure 9.9: Data Set Gym in the Data Table
Specify the Table
To construct the appropriate two-way table and request tests of association, follow these steps:- Select Statistics
 Table Analysis ...
 - Select activity from the candidate list as the Row variable.
- Select DietChange from the candidate list as the Column variable.
- Select count from the candidate list as the Cell Counts variable.
Figure 9.10 displays the resulting dialog.
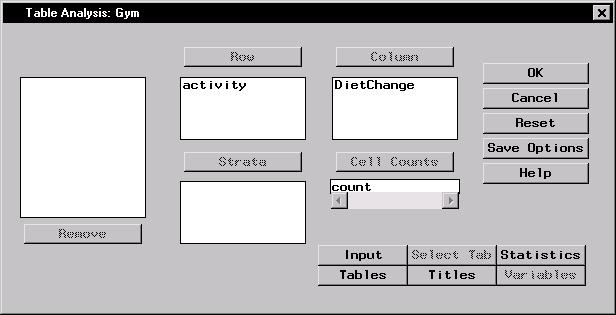 |
Figure 9.10: Table Analysis Task for Health Club Study
Request Tests and Measures of Association
By selecting the rows and columns of the table, you have requested the construction of a 5 × 2 table. To request chi-square tests of association, follow these steps:- Click on the Statistics button.
- Select Chi-square statistics.
- Click OK.
Note that the Tables dialog specifications (see Figure 9.5) made in the previous analysis remain in effect. Therefore, both frequencies and row percentages are produced for this analysis.
Click OK in the Table Analysis dialog to perform the analysis.
Review the Results
The frequency table is displayed in Figure 9.11. Note that 62 percent of those members participating in aerobics were considering a diet change and so were 60 percent of yoga practitioners. Eighty-six percent of those members lifting weights were not considering a diet change. Of those members playing a team sport or who considered themselves cross-trainers, the majority of members were not considering a diet change, but not by a wide margin.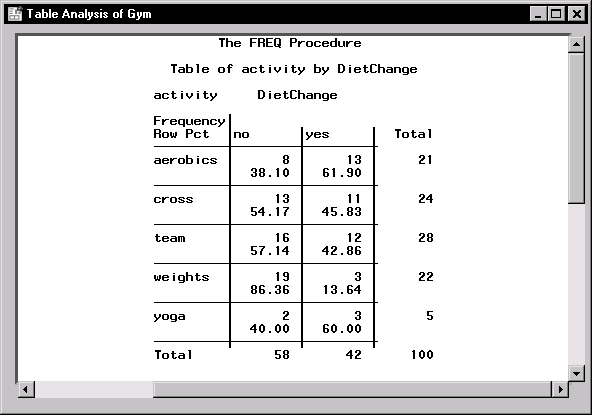 |
Figure 9.11: Frequency Table for Gym Data
Figure 9.12 contains the table of chi-square statistics computed for this table. The Pearson chi-square statistic has a value of 11.4993 and an associated p-value of 0.0215 with 4 degrees of freedom. If you were doing strict hypothesis testing, you would reject the hypothesis of no association at the ![]() = 0.05 level of significance. However, if you look at Figure 9.11, you see that three table cells have a count of less than 5, which violates one of the sample size guidelines for the asymptotic tests. Thus, you may want to compute the exact test for these data.
= 0.05 level of significance. However, if you look at Figure 9.11, you see that three table cells have a count of less than 5, which violates one of the sample size guidelines for the asymptotic tests. Thus, you may want to compute the exact test for these data.
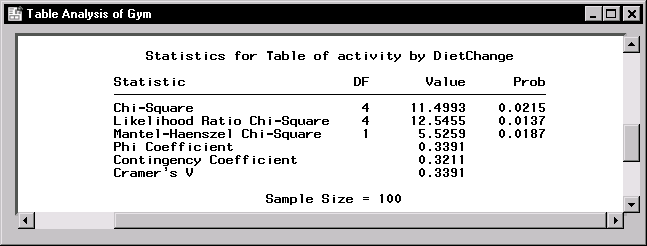 |
Figure 9.12: Chi-square Statistics for Gym Data
Request the Exact Test
To request the exact test, simply return to the Table Analysis task and open the Statistics dialog. All of the settings you have previously selected for the table analysis are still in place. You need only request the additional exact test.
- Select Statistics
 Table Analysis ...
 - Click on the Statistics button.
- Select Exact test for (r × c) table.
- Click OK.
- Click OK in the main Table Analysis dialog to perform the analysis.
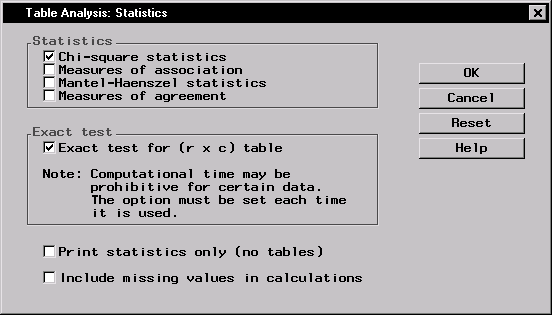 |
Figure 9.13: Statistics Dialog
Figure 9.13 displays the resulting dialog. Notice the warning that exact test computations may take an excessive amount of time. This would not be the case with very small cell counts, but it is an issue for other tables.
Review the Results
Figure 9.14 contains the results of this analysis, including the exact test results.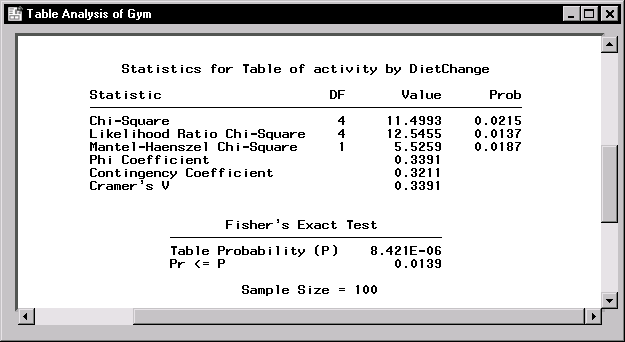 |
Figure 9.14: Exact Test Results
The exact test computes a p-value of 0.0139; thus, this test also results in the rejection of the hypothesis of no association in this table. There is some kind of association between the rows of the table and the columns of the table; type of primary activity made a difference in whether members were considering diet changes. Not only does degree of association seem to vary, but so does the direction. The market research company may end up suggesting that sports and fitness magazines be targeted in different ways for the new food and diet magazine ad campaign.
Copyright © 2007 by SAS Institute Inc., Cary, NC, USA. All rights reserved.