| Overview of ADX |
Exploring Results
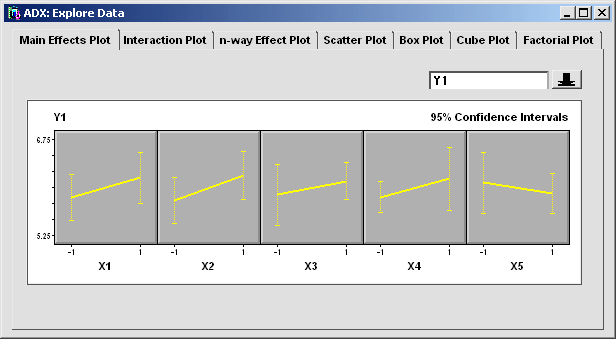
To view the main-effects and interaction plots, click Explore. The Explore Data window will open.
In a main-effects plot, the slope of the line connecting the low level to the high level indicates the strength of the effect or, in this case, the ability of the strain to change the response, pH.
|
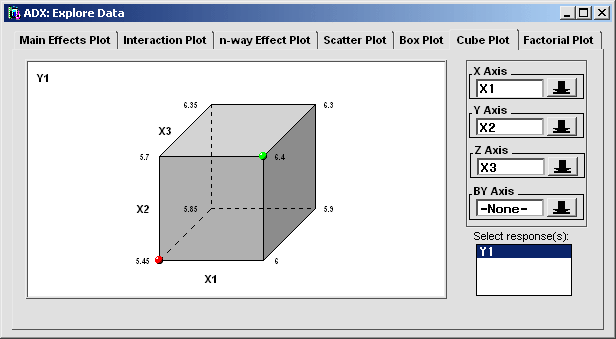
Switch to the cube plot by clicking the Cube Plot tab.
The cube plot, like all the graphics displays in ADX, is interactive. For example, place the mouse pointer over the X1 label. The arrow changes to a hand to indicate that you can click and drag the label to another edge of the cube. You will learn about other interactive features in later chapters.
|
The values at the corners are averages of the response over all runs where the labeled factors in the plot are at the given value. For example, in this plot the average value of Y1 over all runs where strains X1, X2, and X3 are absent is 6.3. The symbols at certain corners indicate which combinations of levels give the highest and the lowest pH (Y1) values. The lowest average pH of 5.45 occurs when strains X1, X2, and X3 are present.
Close the Explore Data window to return to the main design window.
Copyright © 2008 by SAS Institute Inc., Cary, NC, USA. All rights reserved.