Sample 25585: Adjust the size of the text with PROC GPRINT output
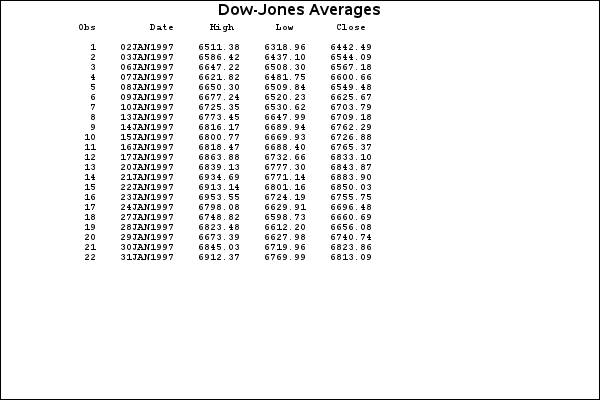
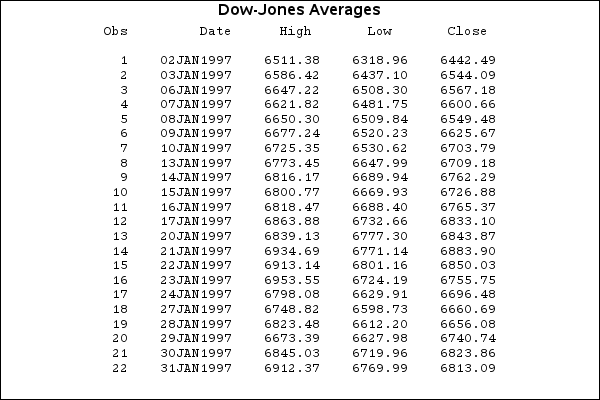
This sample uses PROC GPRINT to create a graph from a text file and demonstrates how to increase the size of the text in the GPRINT output.
These sample files and code examples are provided by SAS Institute
Inc. "as is" without warranty of any kind, either express or implied, including
but not limited to the implied warranties of merchantability and fitness for a
particular purpose. Recipients acknowledge and agree that SAS Institute shall
not be liable for any damages whatsoever arising out of their use of this material.
In addition, SAS Institute will provide no support for the materials contained herein.
This sample uses PROC GPRINT to create a graph from a text file and demonstrates how to increase the size of the text in the GPRINT output.
The graphics output in the Results tab was produced using SAS® 9.2. Submitting
the sample code with releases of SAS prior to SAS 9.2 might produce different results.
 /* Set the graphics environment */
goptions reset=all cback=white border
         ftitle='Albany AMT/bold' htitle=12pt;

 /* Assign the fileref DOW to an external file */
filename dow 'c:\temp\s25585.txt';

 /* Suppress the date line and page numbers */
 /* Set linesize and pagesize */
options nodate nonumber linesize=76 pagesize=24;

 /* Specify the destination for all */
 /* subsequent procedure output     */
proc printto print=dow new;
run;

  /* Create the data set DOWHLC */
data dowhlc;
   input Date date9. High Low Close;
   format date date9.;
   datalines;
02JAN1997   6511.38  6318.96  6442.49
03JAN1997   6586.42  6437.10  6544.09
06JAN1997   6647.22  6508.30  6567.18
07JAN1997   6621.82  6481.75  6600.66
08JAN1997   6650.30  6509.84  6549.48
09JAN1997   6677.24  6520.23  6625.67
10JAN1997   6725.35  6530.62  6703.79
13JAN1997   6773.45  6647.99  6709.18
14JAN1997   6816.17  6689.94  6762.29
15JAN1997   6800.77  6669.93  6726.88
16JAN1997   6818.47  6688.40  6765.37
17JAN1997   6863.88  6732.66  6833.10
20JAN1997   6839.13  6777.30  6843.87
21JAN1997   6934.69  6771.14  6883.90
22JAN1997   6913.14  6801.16  6850.03
23JAN1997   6953.55  6724.19  6755.75
24JAN1997   6798.08  6629.91  6696.48
27JAN1997   6748.82  6598.73  6660.69
28JAN1997   6823.48  6612.20  6656.08
29JAN1997   6673.39  6627.98  6740.74
30JAN1997   6845.03  6719.96  6823.86
31JAN1997   6912.37  6769.99  6813.09
;
run;

 /* Write the text output to disk */
proc print data=dowhlc;
run;

 /* Reset destination for printed output to the default */
proc printto;
run;

 /* Add a title to the graph */
title1 'Dow-Jones Averages';

 /* Generate a graph from the external file */
proc gprint fileref=dow;
run;
quit;

 /* Increase the font size */
goptions htext=11pt;

 /* Generate adjusted graph */
proc gprint fileref=dow;
run;
quit;
These sample files and code examples are provided by SAS Institute
Inc. "as is" without warranty of any kind, either express or implied, including
but not limited to the implied warranties of merchantability and fitness for a
particular purpose. Recipients acknowledge and agree that SAS Institute shall
not be liable for any damages whatsoever arising out of their use of this material.
In addition, SAS Institute will provide no support for the materials contained herein.
This sample uses PROC GPRINT to create a graph from a text file and demonstrates how to increase the size of the text in the GPRINT output.
| Type: | Sample |
| Topic: | SAS Reference ==> Procedures ==> GPRINT
|
| Date Modified: | 2011-04-05 11:14:28 |
| Date Created: | 2005-05-23 14:17:12 |
Operating System and Release Information
| SAS System | SAS/GRAPH | All | 8 TS M0 | n/a |


