Click on the About tab within each sample for product and release requirements.
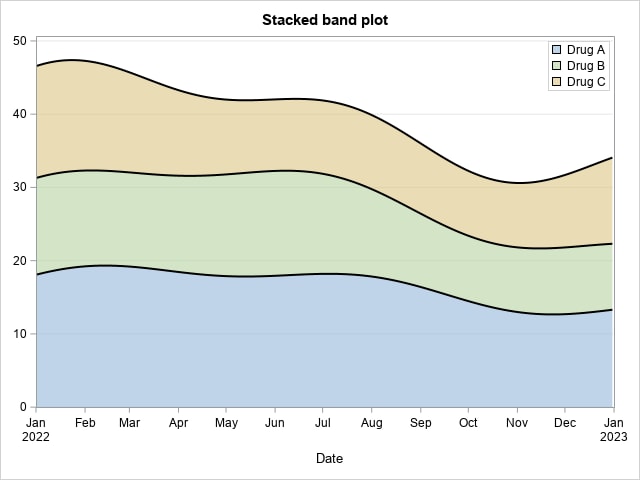
Sample 69831 - Using the BAND statement to create a stacked band plot[ View Code ]
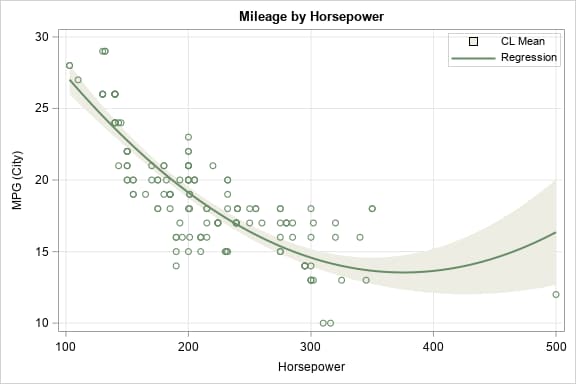
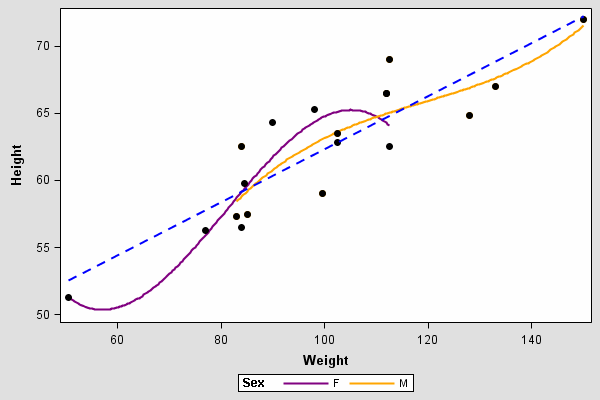
Sample 69823 - Using the DEGREE= option to create a regression plot that specifies the degree of polynomial fit[ View Code ]
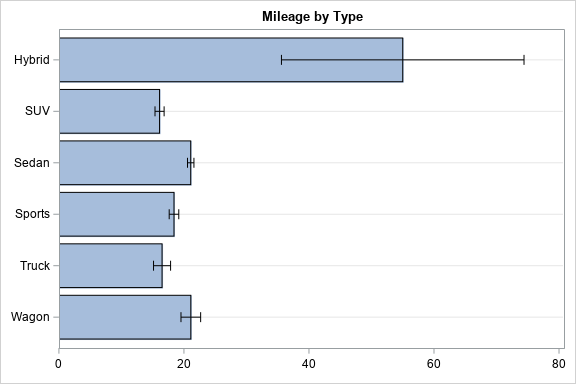
Sample 69822 - Creating a bar chart with confidence limits using the PROC SGPLOT HBAR statement and HBARPARM statement[ View Code ]
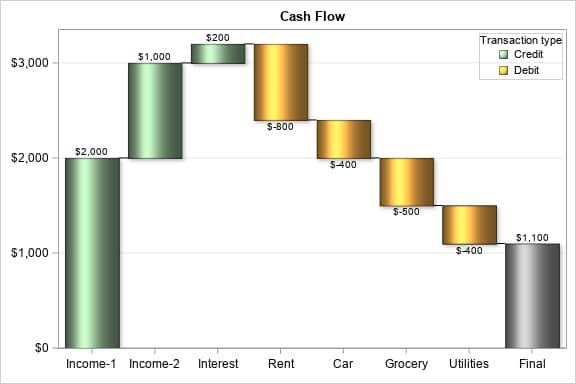
Sample 69821 - Show changes in transaction values with the Waterfall WATERFALL statement [ View Code ]
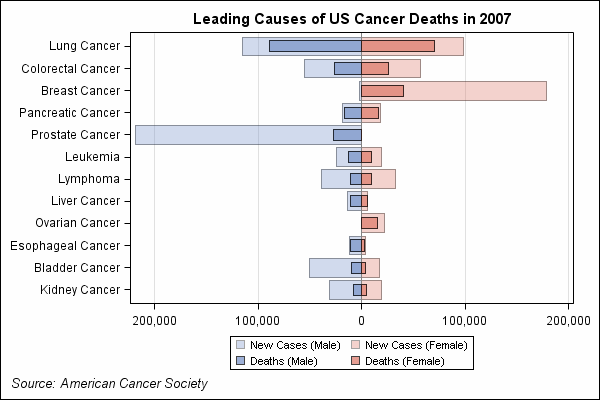
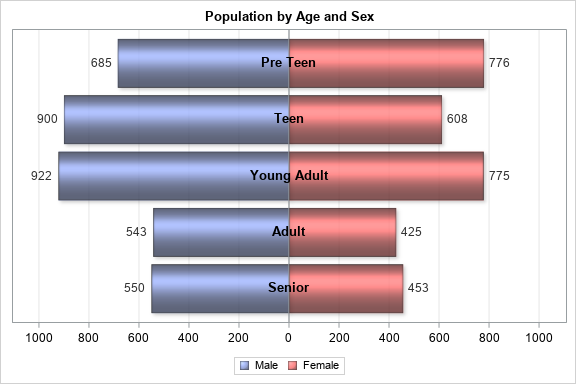
Sample 69820 - Using the SGPLOT procedure to create a butterfly plot with text[ View Code ]
Sample 69819 - Using the SGPLOT procedure with the VBAR and VLINE statements to create a bar chart with line overlay[ View Code ]
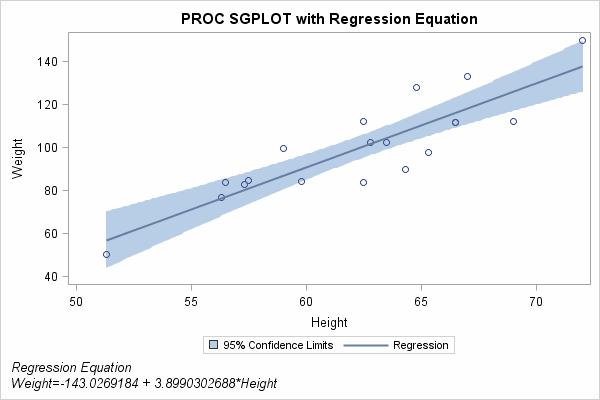
Sample 65202 - Add the regression equation and descriptive statistics to a linear regression model with PROC SGPLOT[ View Code ]

Sample 56933 - Display special symbols as axis values using PROC FORMAT with PROC SGPLOT[ View Code ]

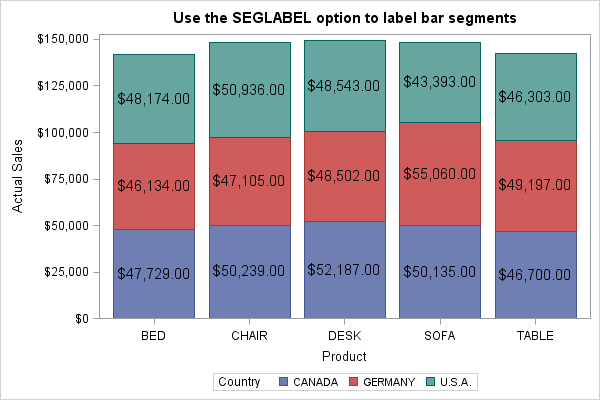
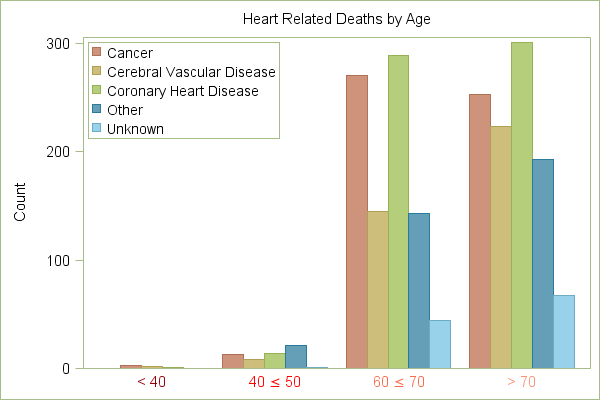
Sample 55866 - Use the SEGLABEL option to label bar segments in a bar chart[ View Code ]
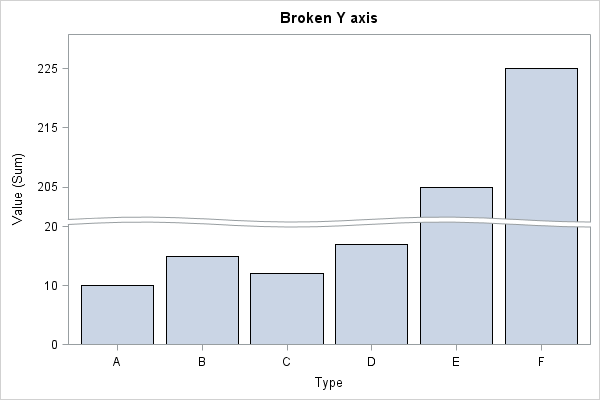
Sample 55683 - Create a broken Y axis[ View Code ]
Sample 54315 - Customize your symbols with the SYMBOLCHAR statement in PROC SGPLOT[ View Code ]
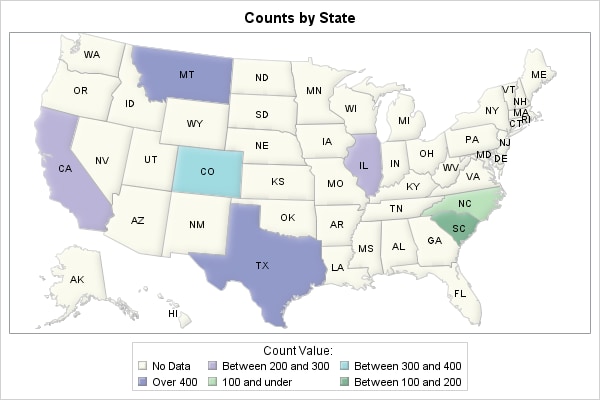
Sample 53367 - Create a map with the SGPLOT procedure[ View Code ]
Sample 52964 - Create a spaghetti plot with the SGPLOT procedure[ View Code ]

Sample 51821 - Fill the area between plot lines using the BAND statement in PROC SGPLOT[ View Code ]
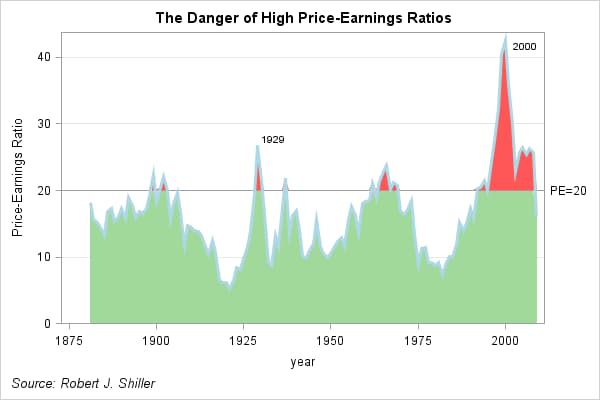
Sample 51350 - Create filled areas based on the value of the Y variable[ View Code ]
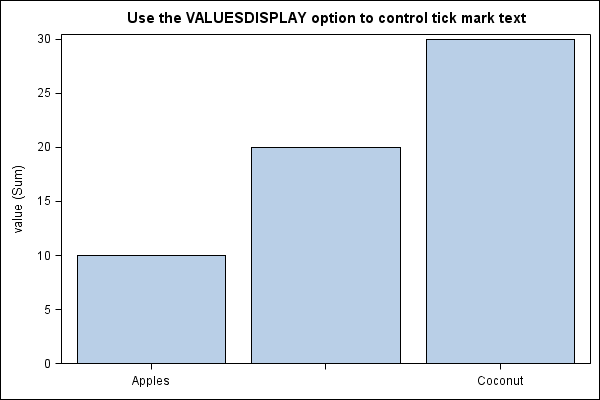
Sample 50930 - Change the values that are displayed for tick marks[ View Code ]
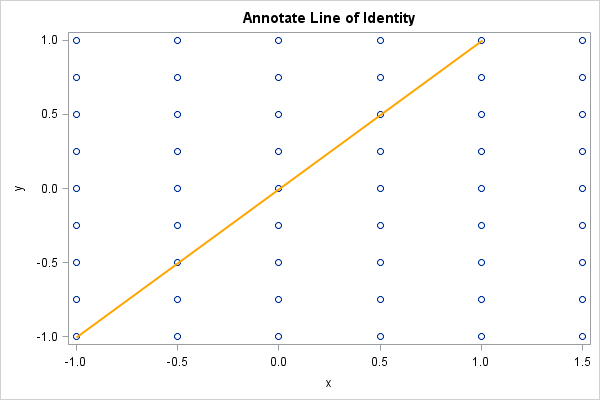
Sample 49302 - Annotate a line of identity on PROC SGPLOT output[ View Code ]
Sample 49301 - Annotate a logarithmic axis with PROC SGPLOT[ View Code ]
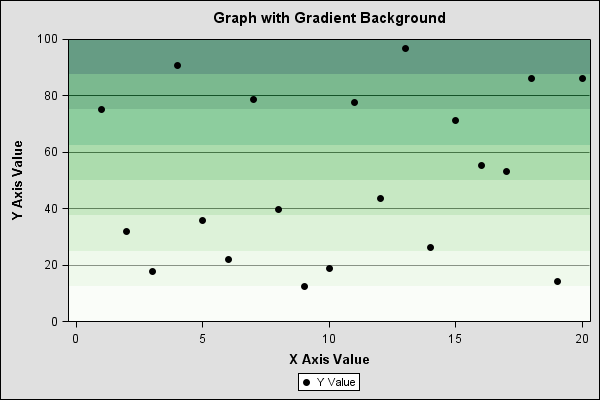
Sample 49070 - Add gradient shading behind a graph[ View Code ]
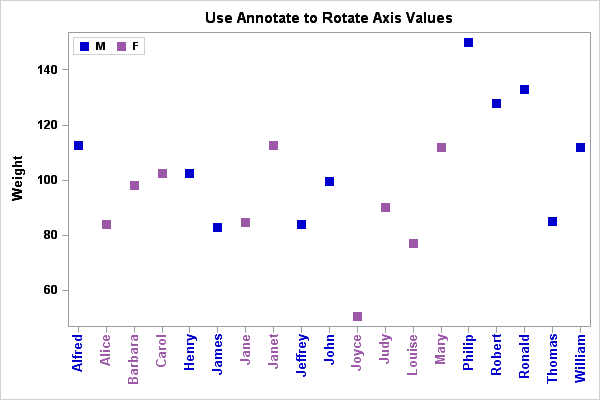
Sample 48432 - Use SG Annotation to rotate axis values in SGPLOT procedure output[ View Code ]
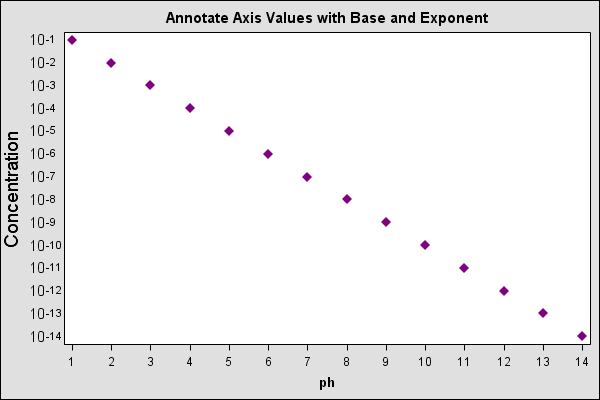
Sample 48123 - Annotate special symbols as axis values[ View Code ]
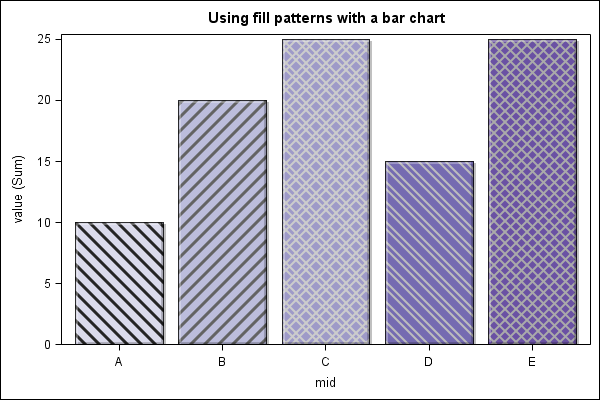
Sample 45663 - Bar chart using fill patterns[ View Code ]
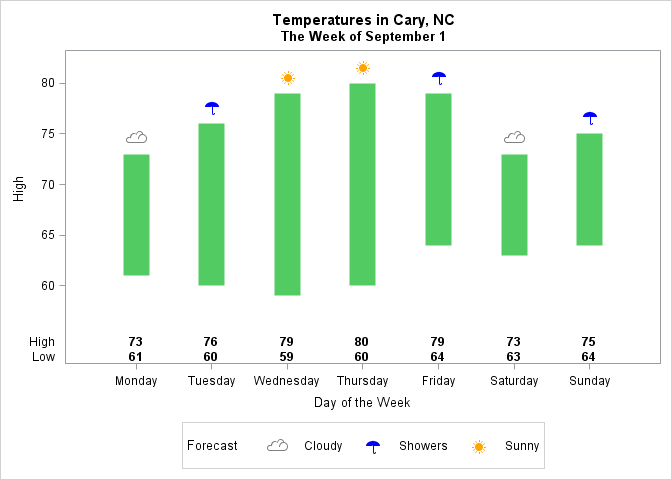
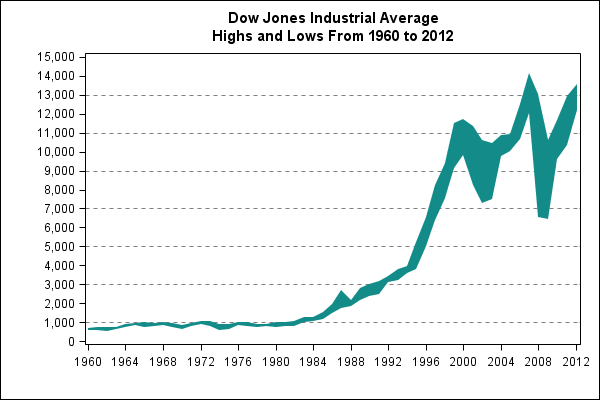
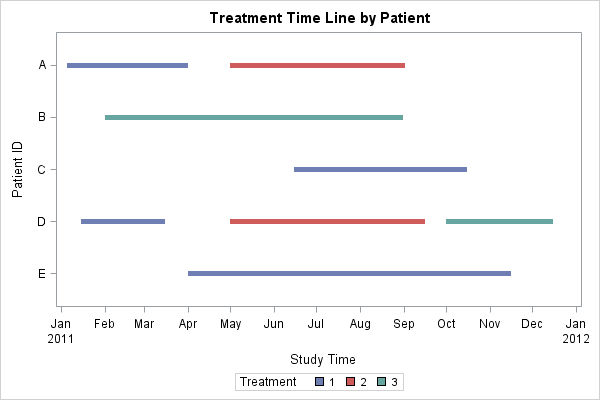
Sample 45087 - Create a time line with the HIGHLOW statement in PROC SGPLOT[ View Code ]
Sample 43912 - Create a Loess fit plot with PROC SGPLOT[ View Code ]


Sample 43731 - Create a graph with PROC SGPLOT with colors defined using an attribute map[ View Code ]
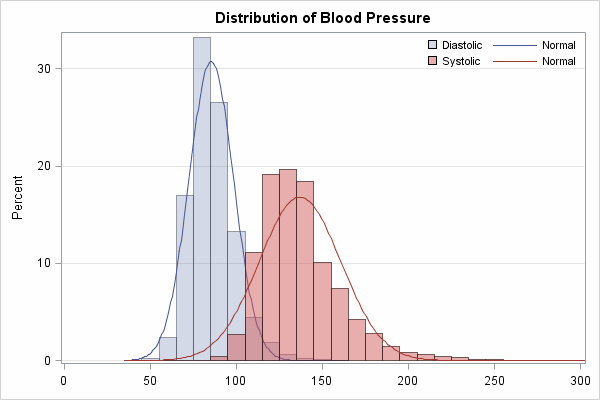
Sample 43365 - Overlay multiple histograms and density curves in a single cell using PROC SGPLOT[ View Code ]
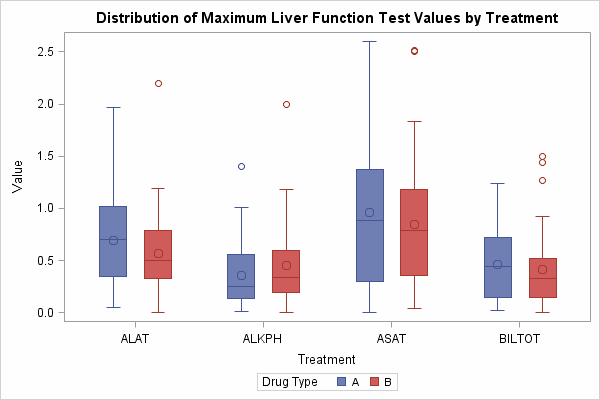
Sample 43090 - Box plot of treatments grouped by drug type[ View Code ]
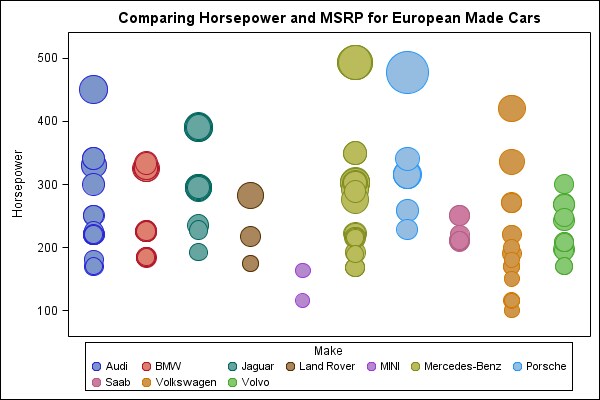
Sample 43071 - Compare horsepower and MSRP using a bubble plot[ View Code ]
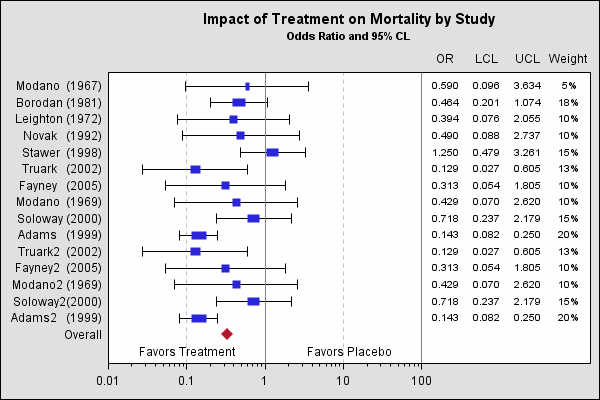
Sample 42867 - Create a forest plot with the SGPLOT procedure[ View Code ]
Sample 42855 - Highlight a value on a graph[ View Code ]

Sample 42542 - Plot means with standard error bars from calculated data with PROC SGPLOT[ View Code ]

Sample 40504 - Add the regression equation to a regression plot generated with PROC SGPLOT[ View Code ]
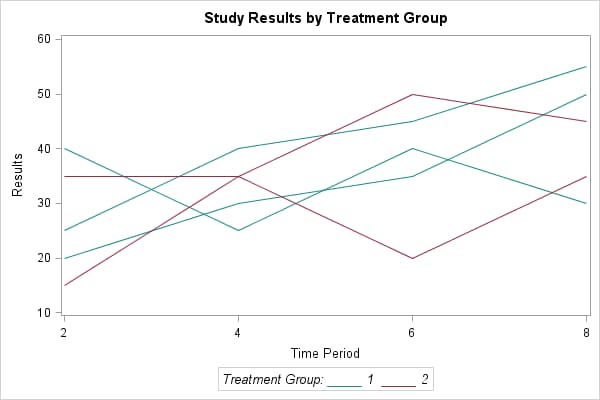
Sample 40255 - Plot of study results by treatment group[ View Code ]
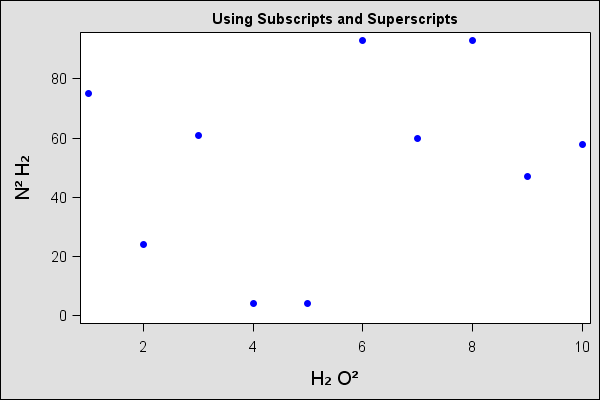
Sample 39267 - Create subscripts and superscripts in PROC SGPLOT output[ View Code ]
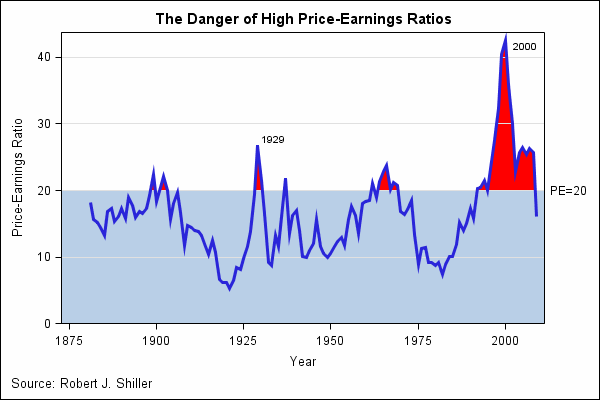
Sample 39142 - The danger of high price-earnings ratios[ View Code ]
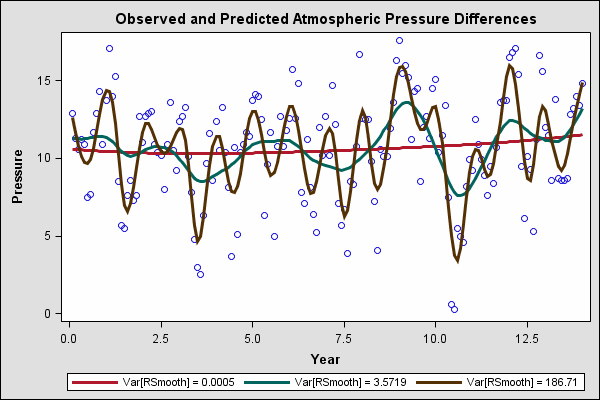
Sample 39137 - Observed and predicted atmospheric pressure differences[ View Code ]
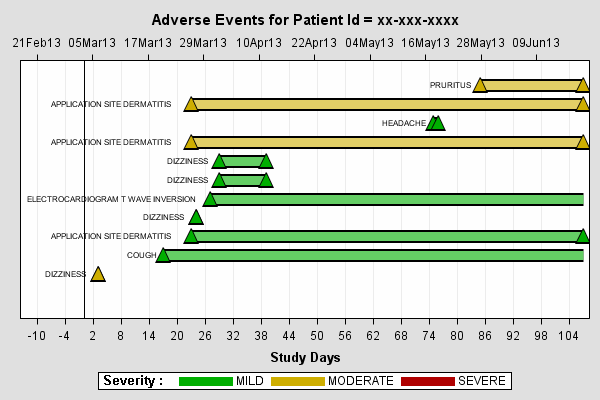
Sample 39078 - Adverse events for patient ID[ View Code ]
Sample 35864 - Change line colors and styles for PROC SGPLOT output[ View Code ]
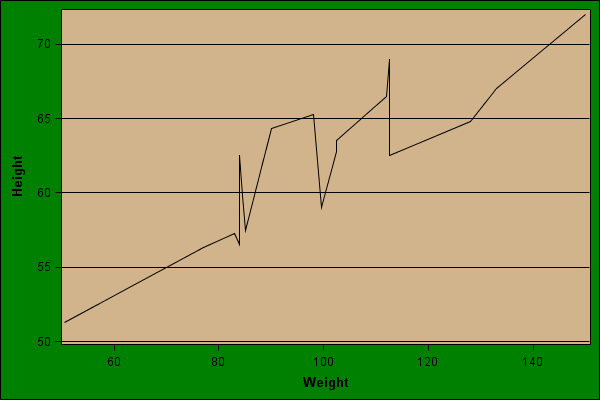
Sample 35840 - How to change the color of background areas and grid lines for ODS GRAPHICS output[ View Code ]
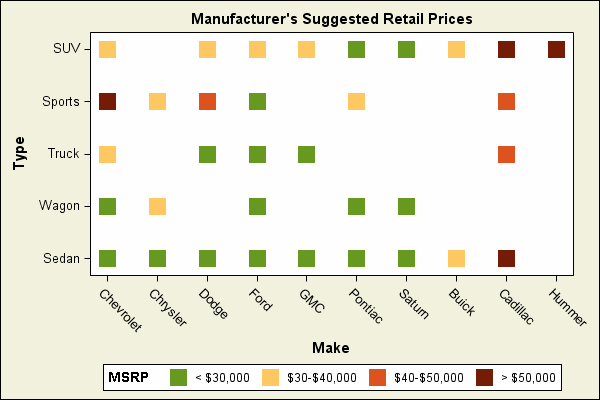
Sample 35215 - Heat Map with Discrete Axis[ View Code ]
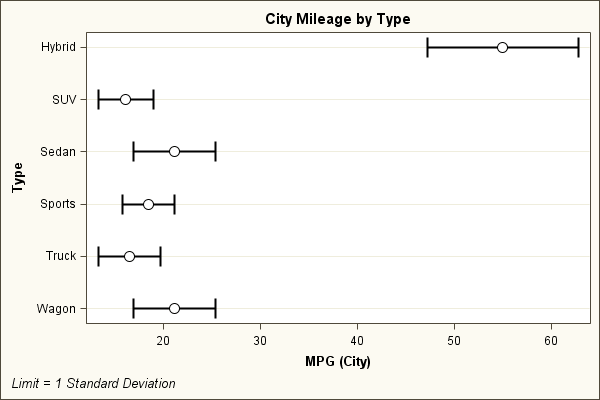
Sample 35166 - Dot Plot with Standard Deviation[ View Code ]
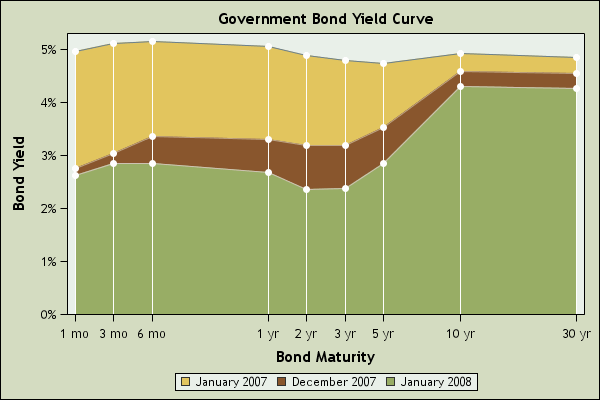
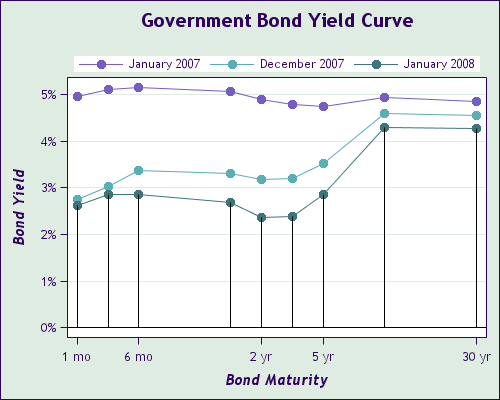
Sample 35163 - Government bond yield curve[ View Code ]
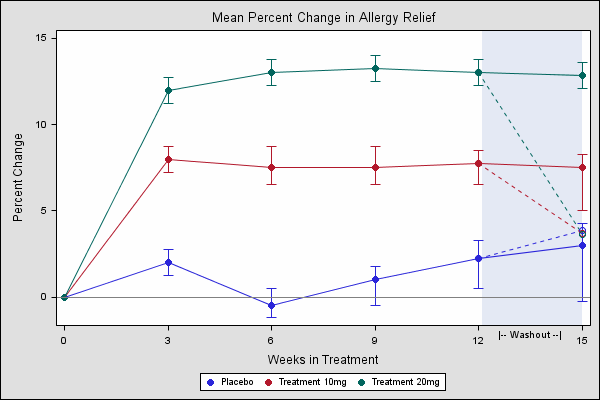
Sample 35053 - Mean percent change in allergy relief[ View Code ]
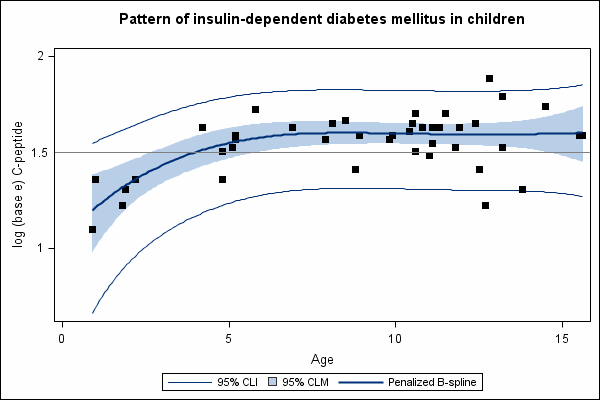
Sample 35052 - Pattern of insulin-dependent diabetes mellitus in children[ View Code ]
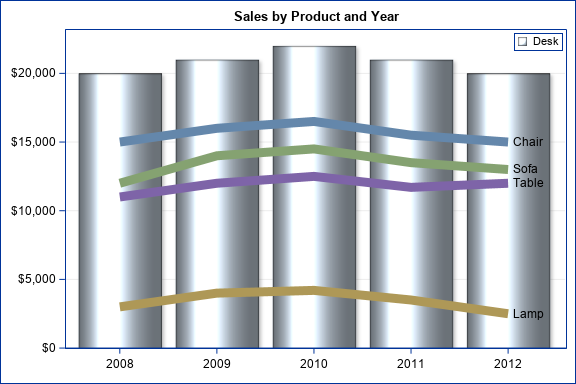
Sample 31510 - Stacked band plot with overlay lines[ View Code ]
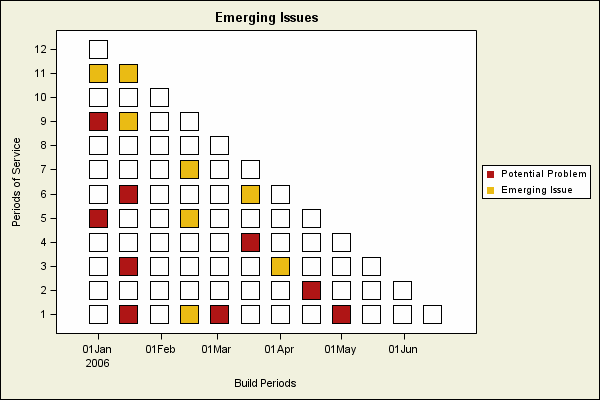
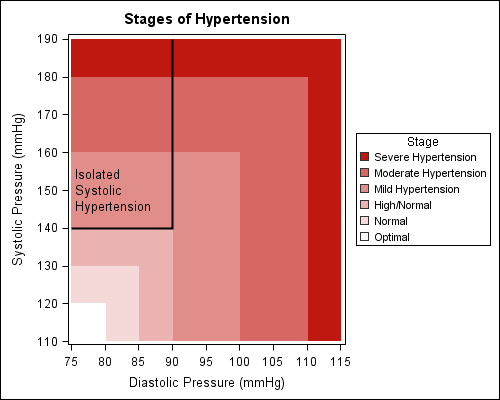
Sample 31509 - Create a risk map[ View Code ]
Sample 31507 - Create a needle plot with PROC SGPLOT[ View Code ]
Sample 31489 - Produce a heat map[ View Code ]