Graphics Samples Output Gallery
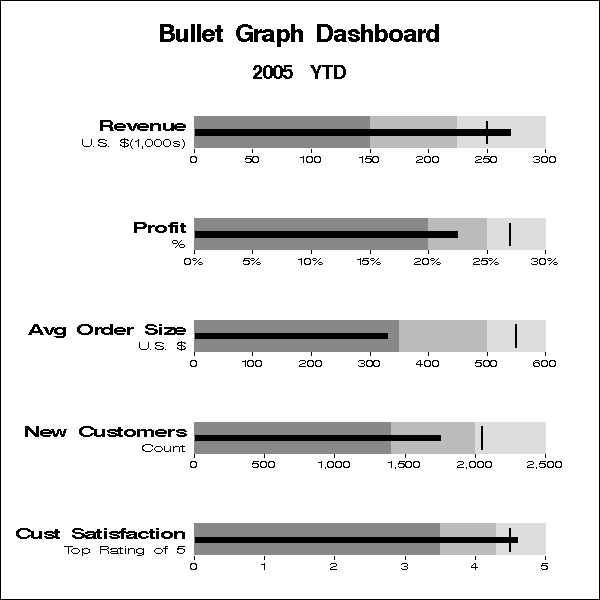
Click on the About tab within each sample for product and release requirements.Sample 26127 - Create a dashboard with multiple bullet graph indicators for use in a portlet[ View Code ]

Sample 26117 - Create a dashboard with multiple bullet graph indicators using a stored process[ View Code ]