Click on the About tab within each sample for product and release requirements.
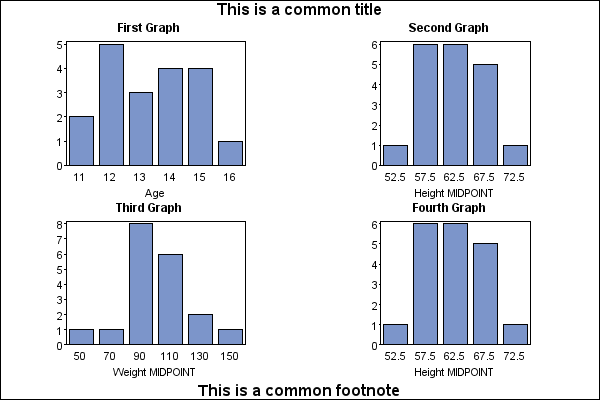
Sample 25590 - Add a common title and footnote to PROC GREPLAY output[ View Code ]
Sample 24946 - Dynamically replay graphs to individual GIF files using PROC GREPLAY[ View Code ]

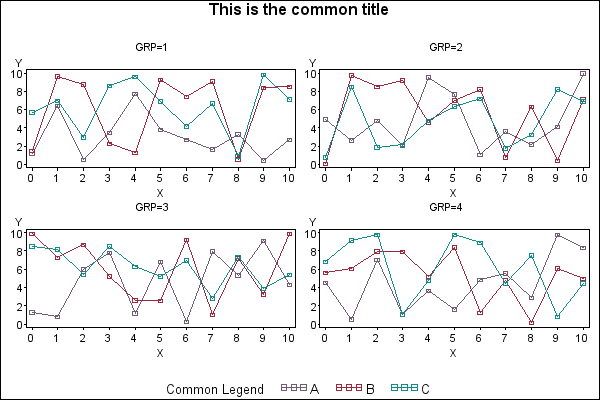
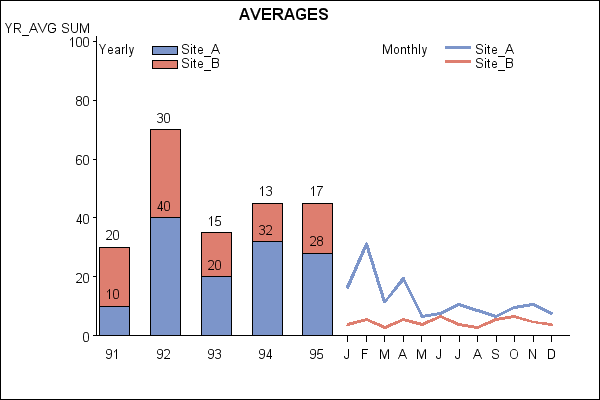
Sample 24945 - Replay graphs with a common title and legend with PROC GREPLAY[ View Code ]
Sample 24944 - Use GREPLAY and macro code to replay a specific number of graphs per page[ View Code ]

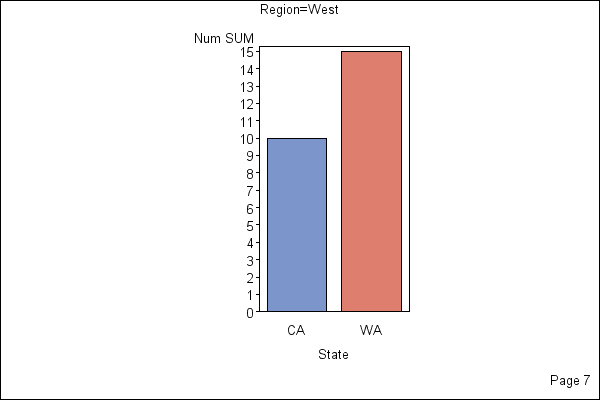
Sample 24943 - Use PROC GREPLAY to display page numbers on replayed graphs[ View Code ]
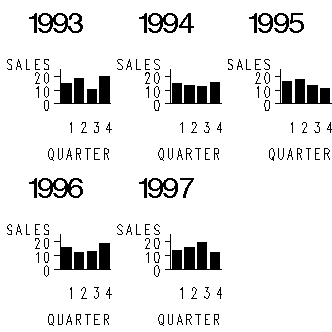
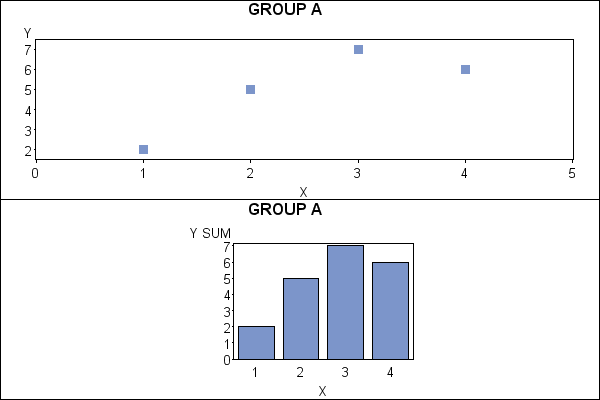
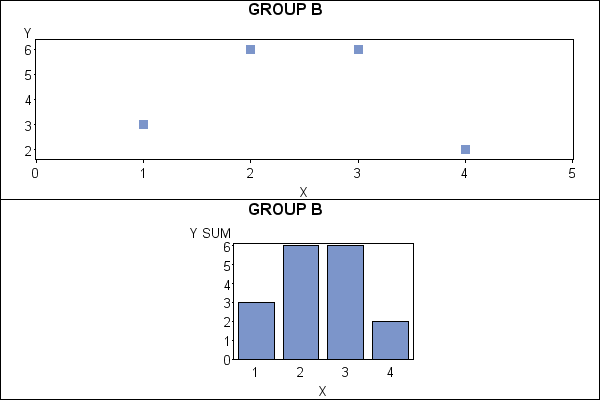
Sample 24942 - Use PROC GREPLAY to dynamically replay GCHART and GPLOT output on the same page[ View Code ]
Sample 24941 - Use PROC GREPLAY to display a vertical bar chart and a plot side by side[ View Code ]
Sample 24940 - Dynamically replay all GSEG entries[ View Code ]
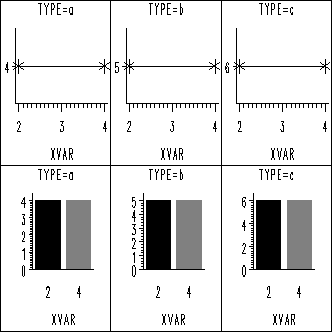
Sample 24939 - Dynamically define template panels[ View Code ]